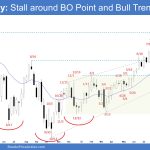
Market Overview: S&P 500 Emini Futures The weekly chart formed an Emini test breakout point; a two-legged pullback testing the February 2 high (breakout point) and the bull trend line. The bulls see the current move down simply as a 50% pullback (of the move which started in March) within a broad bull channel. If […]
If you are not seeing the latest Weekly Report below, your PC/device browser is likely showing you an earlier page copy. Simply refresh your browser. For PCs you can use the F5 key, or Ctrl-F5, several times if needed.
Crude Oil Strong Pullback
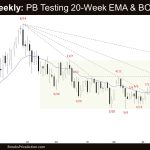
Market Overview: Crude Oil Futures The weekly chart formed a Crude Oil strong pullback testing the breakout point (April high; trading range high) and the 20-week EMA. The bulls want the 20-week EMA to act as a support and a reversal up from a higher low. The bears want a reversal down from a large […]
EURUSD Climactic Bear Leg
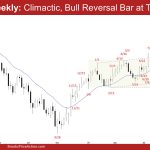
Market Overview: EURUSD Forex The weekly chart formed a EURUSD climactic bear leg in the form of a tight bear channel. Odds favor the first pullback to be minor and a retest of the current leg extreme low (Oct 3). The bulls need to create sustained follow-through buying to increase the odds of a deeper […]
Bitcoin up to 28k but Limit Order Market and BOM
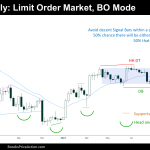
Market Overview: Bitcoin Bitcoin up to 28k. On the Weekly chart, the price is contained within a Trading Range Pattern, which is also a Breakout Mode (BOM) pattern. Most good signal bars are not good setups when the price is within a BOM. Until the BOM is not broken, Traders are in stand by mode, […]
Nifty 50 Spike and Channel Up
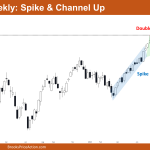
Market Overview: Nifty 50 Futures Nifty 50 Spike and Channel Up on the weekly chart. On the weekly chart, the market provided a bullish close with a long tail at the bottom, and it is currently trading close to the bottom trendline of the bull channel, suggesting that bulls may buy at the high of […]
FTSE 100 Confusing BOM Between 2 Moving Averages
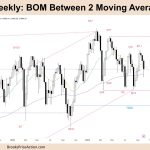
Market Overview: FTSE 100 Futures The FTSE futures market is in breakout mode (BOM) between 2 moving averages. The market is deciding where to go from here. There is a DB and a DT. It can be a wedge bull flag or a wedge bear flag. Take your pick! On this timeframe 50/50 so better to […]
DAX 40 Wedge Bull Flag, Bear BO or Bigger ET?
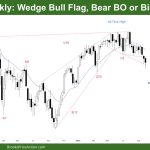
Market Overview: DAX 40 Futures DAX futures moved sideways to down last week with a bear bar in what looks like a wedge bull flag. But it is confusing, for some traders it is always in short. Because we broke below the swing low, tested and now are moving down below the MA. For other […]
Nasdaq 100 Entry Bar to the Reversal Bar of 9/25
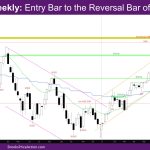
Market Overview: NASDAQ 100 Emini Futures The NASDAQ Emini futures week is a bull trend bar with a tail below at the weekly exponential moving average (EMA). It is an entry bar to the reversal bar of 9/25, closing above the high of last week. On the daily chart, this week looks like a trading […]
No report today — Brad travelling
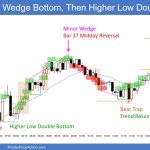
Friday October 6, 2023 Yesterday’s Emini setups Al created the SP500 Emini charts. Here are several reasonable stop entry setups from yesterday. I show each buy entry with a green rectangle and each sell entry with a red rectangle. Buyers of both the Brooks Trading Course and Encyclopedia of Chart Patterns have access to a […]
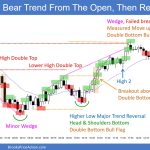
Emini Failed Breakout below September 27 Low
Trading Update: Thursday October 5, 2023 S&P Emini pre-open market analysis Emini daily chart Emini 5-minute chart and what to expect today Yesterday’s Emini setups Al created the SP500 Emini charts. Here are several reasonable stop entry setups from yesterday. I show each buy entry with a green rectangle and each sell entry with a […]

