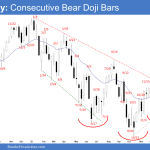
Market Overview: S&P 500 Emini Futures The S&P 500 Emini futures weekly chart formed a pair of Emini consecutive dojis. There are often buyers below the first pullback from a strong channel up like the tight 8-bar bull micro channel. The bulls hope to get at least a retest of February high. The bears need […]
If you are not seeing the latest Weekly Report below, your PC/device browser is likely showing you an earlier page copy. Simply refresh your browser. For PCs you can use the F5 key, or Ctrl-F5, several times if needed.
Weekend Crude Oil 13-week Trading Range
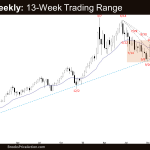
Market Overview: Crude Oil Futures The Crude oil futures market is in a 13-week trading range. Poor follow-through and reversals are more likely within a trading range. Traders will BLSH (Buy Low, Sell High) until there is a breakout from either direction. If the bears get follow-through selling next week, it will increase the odds of a […]
EURUSD Outside Bull Doji
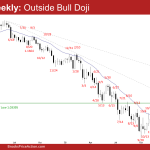
Market Overview: EURUSD Forex The EURUSD Forex weekly candlestick was an outside bull doji. Bulls want a continuation of the bull channel up, while the bears want a test of the 20-week exponential moving average and the January 6 low. The bulls want any pullback to be sideways and not deep. If the pullback is […]
Bitcoin Entering Sell Zone
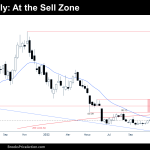
Market Overview: Bitcoin Futures Bitcoin entering sell zone. During this week, the price increased by +14.21% of its value. Traders should expect a leg sideways to down testing 2022 lows starting within the next months. Bitcoin futures The Weekly chart of Bitcoin futures Analysis Trading The Daily chart of Bitcoin futures Analysis Trading Market analysis reports […]
Nifty 50 Micro Double Top
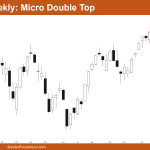
Market Overview: Nifty 50 Futures Nifty 50 micro double top on the weekly chart, but since the market formed a bull bar this week, few bears would be shorting below the bar 1 (shown on the weekly chart below). However, given that the market is still moving inside of a bear channel, some bears might […]
FTSE 100 Big Bull Breakout above All-Time High
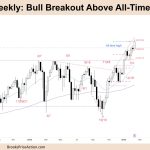
Market Overview: FTSE 100 Futures The FTSE futures market was a FTSE 100 big bull breakout above the all-time high. The bears have been unable to make money in this tight channel. The bears that sold the double top at the high of the trading range are now trapped and might force the price higher. The […]
DAX 40 Micro Double Top at Measured Move Target
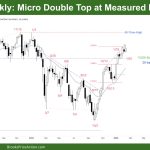
Market Overview: DAX 40 Futures DAX 40 micro double top at a measured move target. It’s a tight bull channel that is slowing down, and we might need to go sideways for profit-taking next week. The daily chart is forming a possible head and shoulders top, which could signal a two-legged pullback. The lack of […]
Nasdaq 100 Continued Pause in Bull Micro Channel at Monthly EMA
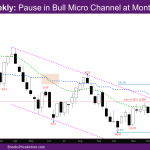
Market Overview: NASDAQ 100 Emini Futures The NASDAQ Emini futures continued pause with another doji week sideways at the monthly exponential moving average (EMA). The month so far is a bull bar with a big tail above. As expected, the upside was limited given big sideways bars in the previous few months. It is likely […]
Emini Bears Want Downside Breakout and Test of February 10 Low
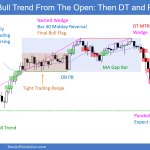
Trading Update: Friday February 17, 2023 Emini pre-open market analysis Emini daily chart Emini 5-minute chart and what to expect today Emini intraday market update Yesterday’s Emini setups Tim created the SP500 Emini chart from Al’s provided summary & setups Here are several reasonable stop entry setups from yesterday. I show each buy entry with […]
Emini in Breakout Mode, Forming Triangle above Moving Average
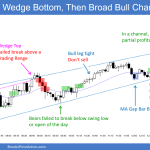
Trading Update: Thursday February 16, 2023 Emini pre-open market analysis Emini daily chart Emini 5-minute chart and what to expect today Emini intraday market update Yesterday’s Emini setups Tim created the SP500 Emini chart from Al’s provided summary & setups Here are several reasonable stop entry setups from yesterday. I show each buy entry with […]

