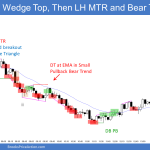
Trading Update: Monday July 25, 2022 Emini pre-open market analysis Emini daily chart The bulls broke above the neckline (June 28) of the double bottom (July 14) last week. Bulls want breakout to lead to a measured move up and test of the June 2nd major low or high. The measured move from the July […]
If you are not seeing the latest Weekly Report below, your PC/device browser is likely showing you an earlier page copy. Simply refresh your browser. For PCs you can use the F5 key, or Ctrl-F5, several times if needed.
Emini second leg sideways to up pullback
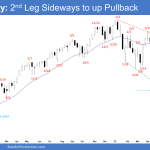
The S&P 500 Emini futures traded higher from a higher low major trend reversal. Bulls need to create a consecutive bull bar (follow-through buying) next week, something they have failed to do since March. The bear trend line and 20-week exponential moving average remain resistances above. If next week closes as a bear bar instead, it will mean the bulls failed to get follow-through buying yet again. Odds of a re-test of June low increases.
Nasdaq 100 bull breakout attempt
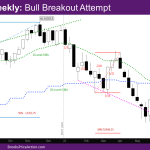
Market Overview: NASDAQ 100 Emini Futures NASDAQ 100 bull breakout attempt above the tight trading range (TTR) that has been going on for the last 4 weeks. The week closed with a bull body, but a big tail at the top and bottom. We have been saying for a couple of weeks now that prices […]
EURUSD sideways at wedge bottom pullback
The EURUSD Forex broke below the 2017 low with follow-through selling recently. The bulls want a reversal higher from a wedge bottom (Mar 4, May 13 and July 14) and a trend channel line overshoot. However, the move down is in a tight bear channel. That means strong bears. Odds slightly favor lower prices for the EURUSD after a larger pullback.
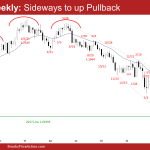
Bitcoin pullback after stalled at major support
Market Overview: Bitcoin Futures Bitcoin pullback finally became a reality after the price stalled at major support. Traders expect the price to reach $28800 during the upcoming months. Bitcoin futures The Weekly chart of Bitcoin futures Traders still think that the Bear Trend on the Weekly chart is contained within a Trading Range; therefore, the […]
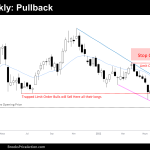
FTSE 100 double top pullback testing prior breakout
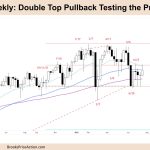
Market Overview: FTSE 100 Futures The FTSE futures market was a double top pullback testing the prior breakout. We have been going sideways for many weeks now so it’s a tight trading range ready to break out either way. The longer we go sideways the less steam the bears might have to push down further. The […]
DAX 40 High 1 bear channel pullback
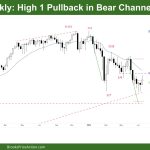
Market Overview: DAX 40 Futures DAX futures was a High 1 Bear Channel Pullback. It’s a major trend reversal on the daily timeframe but still always in short on the weekly. Confusion, sideways but probably more upside as we are struggling to get below the March lows. Both DAX and FTSE are looking stronger but […]
Nifty 50 futures micro channel
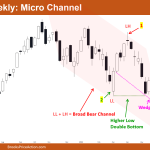
Market Overview: Nifty 50 Futures Nifty 50 futures micro channel on weekly chart with strong bull close, but near a major swing high, so high probability of Double Top attempt in the coming week. Overall market structure on weekly chart is broad bear channel, so you can always buy low and sell high (broad channels […]
Emini strong breakout above neckline of double bottom
Trading Update: Friday July 22, 2022 Emini pre-open market analysis Emini daily chart The bulls have done a great job getting consecutive bull closes above the June 28 high this week. This will likely lead to a successful bull breakout above neckline (June 28) of the double bottom (June 30 and July 14). Bulls want […]
Emini bulls want consecutive bull closes above June 28
Trading Update: Thursday July 21, 2022 Emini pre-open market analysis Emini daily chart The bulls got a follow-through bar following the July 19 bull breakout. They hope today will be another bull close which would create consecutive bull closes above June 28 and increase the probability of higher prices. Yesterday was also a close above […]

