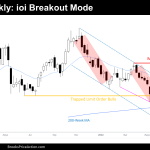
Market Overview: Bitcoin Futures The Bitcoin futures traded during the entire week inside the price range of the prior week, giving a Bitcoin ioi breakout mode. After the 28% recovery in July, Traders wonder if this is just a Bear Rally or if the price is trying to consolidate a bottom. Bitcoin futures The Weekly […]
If you are not seeing the latest Weekly Report below, your PC/device browser is likely showing you an earlier page copy. Simply refresh your browser. For PCs you can use the F5 key, or Ctrl-F5, several times if needed.
FTSE Always in long at top of trading range
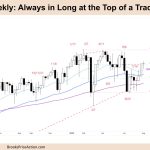
Market Overview: FTSE 100 Futures FTSE always in long at the top of a trading range. We are back in the tight trading range from May so we might go sideways here. The bulls want a follow-through bar to break above, back to the highs of the range and bears want a decent sell signal. […]
DAX 40 pause at 20-week moving average
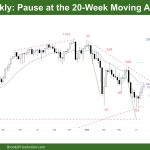
Market Overview: DAX 40 Futures DAX futures moved higher last week but was a pause at 20-Week Moving Average (MA) and ended as a bull doji at the MA. We have been trending down all year and the moving average has been resistance so we should expect bears to sell again above this week. But […]
Nifty 50 measuring gap
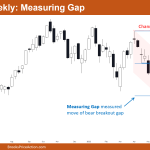
Market Overview: Nifty 50 Futures Nifty 50 measuring gap on the weekly chart formed another bull bar (this time a small one) and continued the bull micro channel after breaking above the bear channel (red). Currently, Nifty has achieved measuring gap and measured move target, so one can expect some profit taking at this level, […]
Emini pullback before test of June 2 high
Trading Update: Friday August 5, 2022 Emini pre-open market analysis Emini daily chart The market is beginning to stall just under the June 2nd high and may have to pullback before test of the high. While the rally up to the June 2nd high has been strong, it is beginning to form a parabolic wedge, […]
Emini likely sideways at June high
Trading Update: Thursday August 4, 2022 Emini pre-open market analysis Emini daily chart Yesterday got within 8 points of the June high. It will probably have to reach it today or tomorrow. Once the market reaches the June 2nd high, Emini likely sideways around that price level. The bulls got the minimum for a second […]
Emini bulls taking partial profits
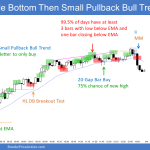
Trading Update: Wednesday August 3, 2022 Emini pre-open market analysis Emini daily chart The sideways trading over the past two days is likely due to bulls taking partial profits than bears establishing short positions. The first reversal down from the July 29th bull breakout will likely fail and lead to a second leg up and […]
Emini first reversal down likely to fail
Trading Update: Tuesday August 2, 2022 Emini pre-open market analysis Emini daily chart The Emini has had a 5-bar bull micro channel with four consecutive bull bars. The odds are beginning to favor at least a minor pullback soon, with Emini first reversal down likely to fail. The odds also favor a test of the […]
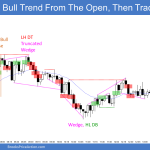
Emini second leg up likely after strong upside breakout
Trading Update: Monday August 1, 2022 Emini pre-open market analysis Emini daily chart The bulls have three strong consecutive bull trend bars on the daily chart with a second leg up likely. The first target for the bulls has been met: the June 9th high, which was the start of the breakout below the June […]
Emini monthly candlestick close above 20-month EMA
The S&P 500 Emini futures closed below the 20-month exponential moving average in June. It reversed to close above the 20-month exponential moving average in July, like the prior 2 occurrences during the sell-off in December 2018 and the Covid-19 sell-off in 2020. The bulls need to create a consecutive bull bar in August to increase the odds of a re-test of the all-time high. July is an inside bull bar. It is a breakout mode pattern. The first breakout has a 50% chance of failing.

