Market Overview: Bitcoin Futures
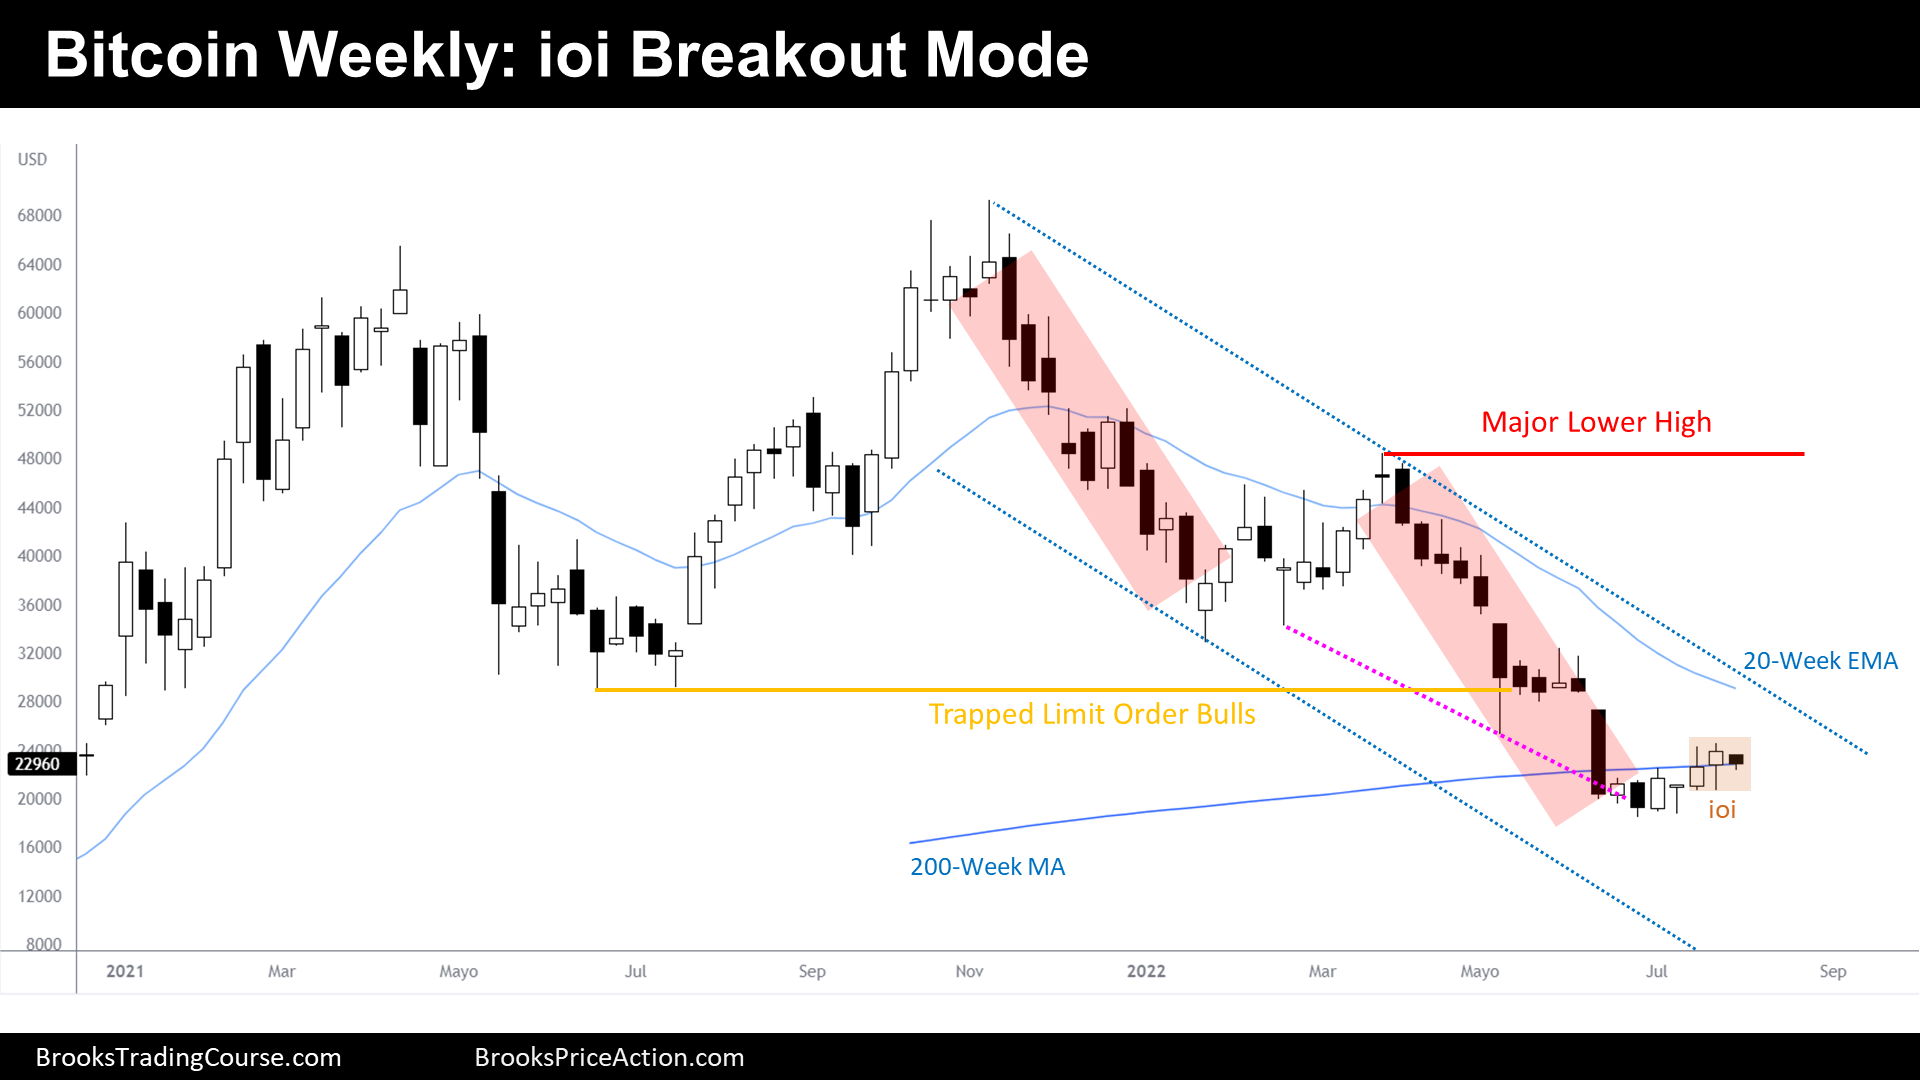
The Bitcoin futures traded during the entire week inside the price range of the prior week, giving a Bitcoin ioi breakout mode. After the 28% recovery in July, Traders wonder if this is just a Bear Rally or if the price is trying to consolidate a bottom.
Bitcoin futures
The Weekly chart of Bitcoin futures

- This week, the price traded within the prior week price range, producing an inside bar.
- Moreover, it produced a Bitcoin ioi Breakout Mode pattern. There is about a 50% chance that it will break out in either direction.
- Last week, we have said that this week we might see a Breakout Bar, as we were coming from 3 consecutive Trading Range Bars. Now we have a Breakout Mode Pattern. Therefore, there is an increased chance of a Breakout during the following weeks.
- The price is within a Bear Channel that now has two legs down. Normally, channels have three legs down, but this channel is contained within a Trading Range, and within Trading Ranges, the price tends to reverse at Support or Resistance.
- Bitcoin stalled at a Major Support and since then, it is trying to test 06/2021 low, where some Major Bulls are trapped.
- Bulls conceive that we are seeing a 2nd Leg Bear Trap at a Major Support. They see that the 2nd Bear Leg looks strong but maybe not enough for the Bears, as there are different ways to draw a Wedge Bottom, a sign of exhaustion.
- Bears believe that we are in a Bear Channel that broke the 06/2021 low and that price is going to achieve a 3rd leg down. Their goal is to end the Bull Trend on the Monthly Chart by trading below the 09/2021 low, right where the Bull Breakout begun.
- I have drawn a Parallel Channel based upon the Major Lower Highs, just to illustrate that the price is at the top half of the Channel, and therefore, it is a Sell Zone.
- If the ioi triggers on the downside and the inertia of the Bear Channel remains dominant, we could see the start of the 3rd leg down from here.
- More likely, after a Wedge Bottom during the formation of the 2nd leg down, we should expect at least another leg sideways to up.
- Bears hope that the Bulls, who are trapped at the 06/2021 low, will significantly move the price lower. It is reasonable for Traders to try to sell around that price, as there are other resistances there, like the 20-week EMA or the Bear trend line.
- Bulls know that there is a significant amount of selling pressure not far from current prices and therefore, they will probably wait until they see a 3rd leg down failing, before entering their longs.
- Bulls would rather not buy around here. Bears would rather not sell.
- But, as we are within the two legs sideways to up period after a wedge bottom, the inertia favor higher prices during next weeks.
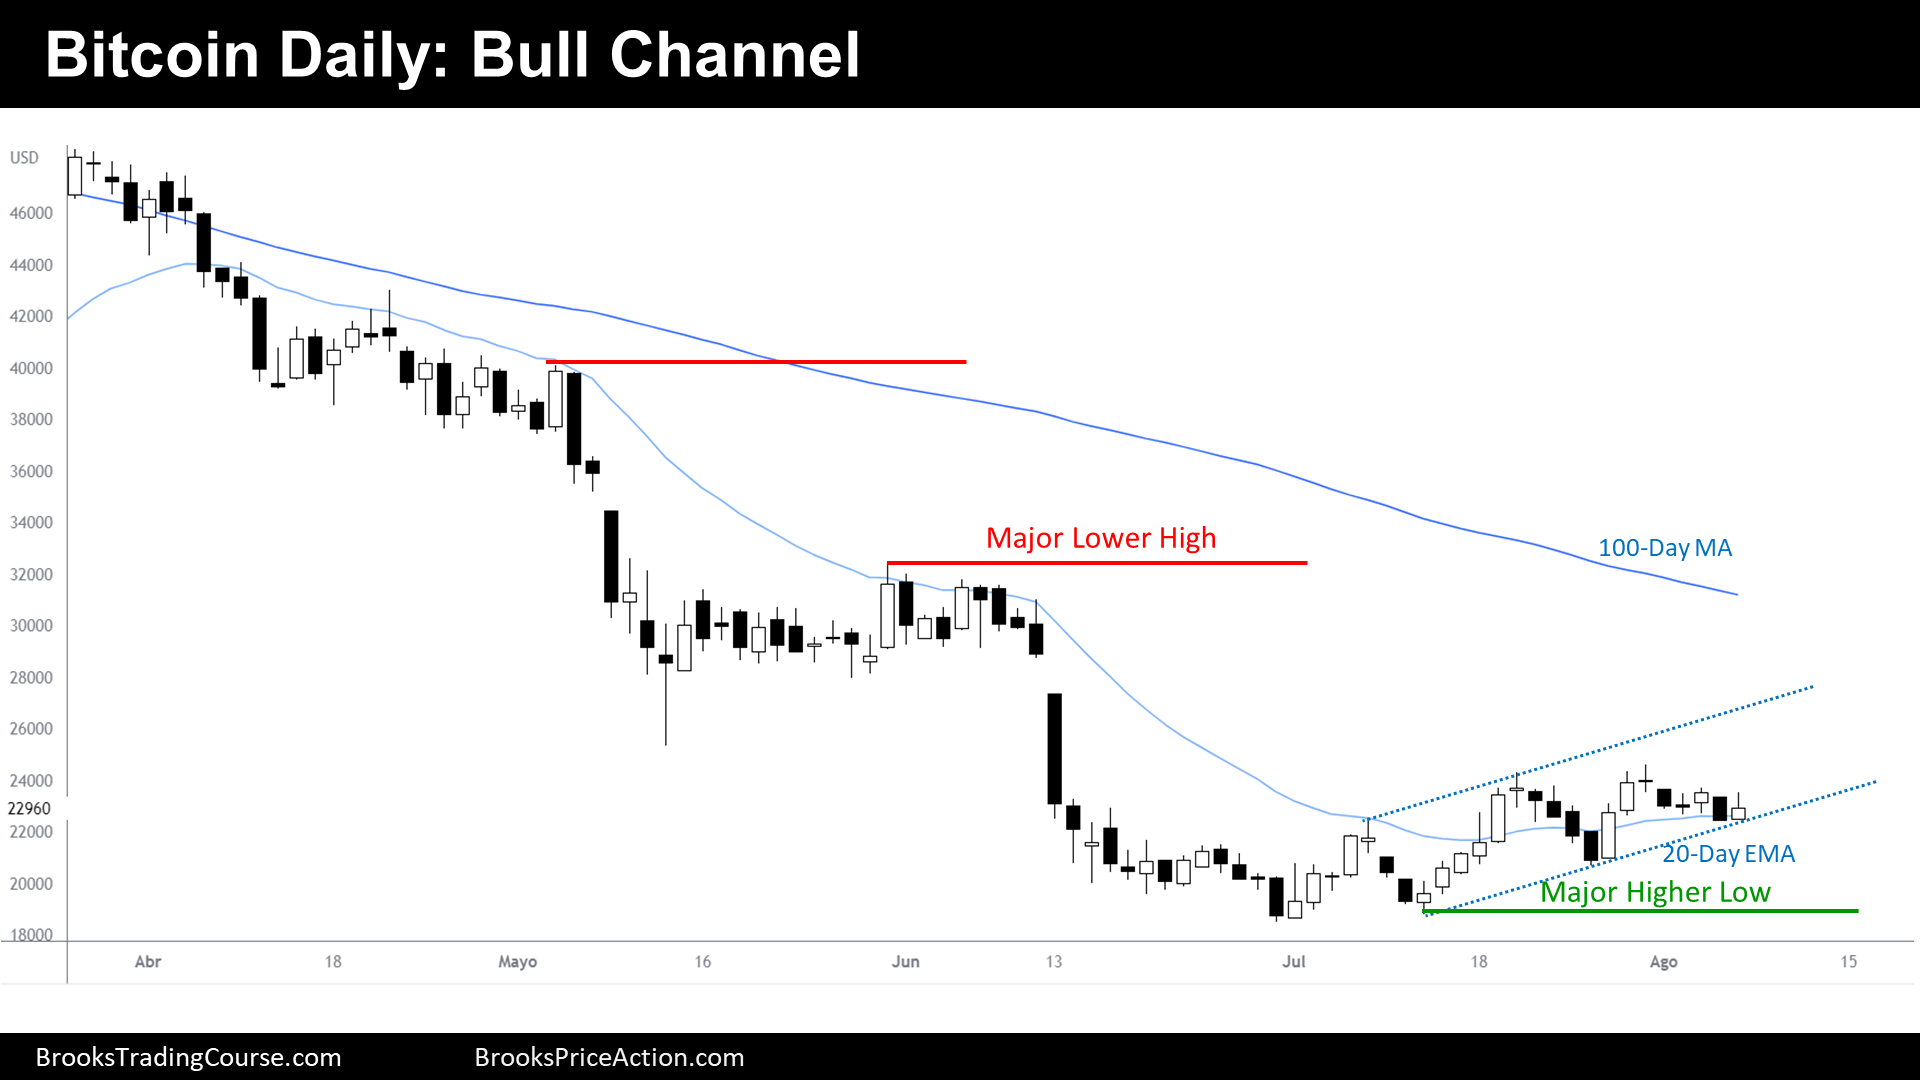
The Daily chart of Bitcoin futures

- Price is trading sideways since mid-June. More than 35 bars after, there are no signs of Bear Trend resumption.
- Prior Pullbacks within the Bear Channel lasted less than 20 bars.
- Since early July, we have been saying that the math works for the Bulls because we were likely in a Trading Range, probably in the Buy Zone.
- When Traders think that they are in a Trading Range, they trade it like a Trading Range. That’s why the 1st reversal after a Strong Bear Trend looks feeble: because Bulls & Bears buy below things instead of above them.
- Now, we are at a time when things might start to accelerate.
- Bulls are slightly finer than Bears, as they conquered the sideways trading goal and that is the best the Bulls can get, normally, after a strong Bear Trend.
- By trading sideways, we are creating Bullish and Bearish setups. The odds are near 50% for each participant, but traders should favor slightly the Bulls here because they earned that right, after conquering the latest goal by stopping the Bearish inertia.
- Furthermore, the price is making Higher Highs and Higher Lows. This is a Bull Channel.
- Most Swing Bulls who bought after the Wedge Bottom or the Double Bottom Higher Low, will reach their Swing Targets around $27000. This means that, in case of Bull Trend continuation, there won’t be much Bull power above that price. Hence, the price could face, exhausted, resistances like the 100-day moving average or the prior Major Lower High.
- If the Bull Channel fails to achieve another Higher High, it will mean that Swing Bulls are not dominant. In that case, it would probably mean that the price sits within a Trading Range between $18600 and $24600.
- For now, we are at a bottom of a Bull Channel; thus, we should expect higher prices during the next following days.
Market analysis reports archive
You can access all weekend reports on the Market Analysis page.