Trading Update: Wednesday November 27, 2024 S&P Emini market analysis Emini daily chart Emini 5-minute chart and what to expect today Yesterday’s Emini setups Al created the SP500 Emini chart. Here are reasonable stop entry setups from yesterday. I show each buy entry bar with a green arrow and each sell entry bar with a […]
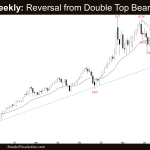
FTSE 100 Small Pullback Bull Trend, Double Top
Market Overview: FTSE 100 Futures The FTSE futures market has been in a small pullback bull trend since COVID. We moved higher last month, retracing the deep 50% pullback in March. The bears are happy with the sell-off before and will look to sell above February. The bulls will buy all pullbacks to the moving average […]
EURUSD Bull Leg in Trading Range
Market Overview: EURUSD Forex EURUSD bull leg currently forming in a trading range. Traders will BLSH (Buy Low, Sell High) within a trading range until there is a strong breakout from either direction with follow-through buying/selling. The bulls want a strong breakout above the February high. The bears want a reversal lower from a double top […]
EURUSD Overlapping Candlesticks
Market Overview: EURUSD Forex The EURUSD Forex monthly chart has 3 overlapping candlesticks. That means that the EURUSD is in a trading range. The bears failed to get follow-through selling in March. The bulls need to create a follow-through bull bar trading above the February high to increase the odds of another leg higher. EURUSD […]
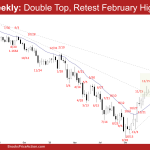
Nifty 50 Big Round Number
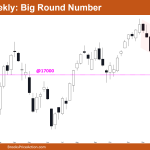
Market Overview: Nifty 50 Futures Nifty 50 big round number acting like a support for the price. Nifty 50 on the weekly is still inside the bear channel and present bear leg is the 3rd bear leg in this bear channel. In this week’s trading, the market formed a tiny bear bar with tails above and […]
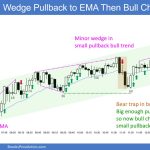
Nifty 50 Wedge
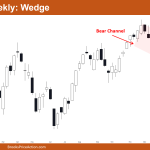
Market Overview: Nifty 50 Futures Nifty 50 wedge on the weekly chart, due to the long wick at the bottom of the candle, bears may not be interested to sell next week. The daily chart of the Nifty 50 showed a bear breakout of the wedge, but it appears that few bears anticipated the move, which […]
FTSE 100 Double Top in Trading Range or Pullback
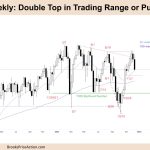
Market Overview: FTSE 100 Futures The FTSE futures market formed a FTSE 100 double top high in a trading range last week, or is it a pullback? The bulls had a tight bull channel, so they expected a second leg after a corrective move sideways to down. It is likely we will test the breakout point […]
Crude Oil Double Top Bear Flag, Higher Low MTR
Market Overview: Crude Oil Futures The Crude oil futures reversed lower from a crude oil double top bear flag. The bears need to break far below the major bull trend line to increase the odds of lower prices. Bulls want a reversal higher from a higher low MTR (major trend reversal). The major bull trend […]
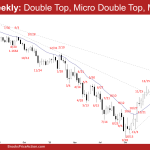
Nifty 50 Futures Wedge Bottom
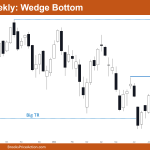
Market Overview: Nifty 50 Futures The Nifty 50 on the weekly chart is forming a Nifty 50 futures wedge bottom and trading range price action, with increasing bad follow-through bars and increasing tails above and below bars. The market is also forming reversal patterns which is a sign that market is in a trading range phase. […]
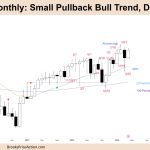
Nifty 50 Double Top and Increased Trading Range Action
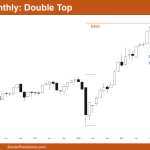
Market Overview: Nifty 50 Futures A Nifty 50 double top formed on monthly chart and showed increasing trading range price action after the breakout of the small bear channel. Market is trading in the current range for the last 10 months now. Nifty 50 on the weekly chart has filled the breakout gap, so now less […]

