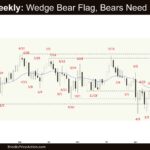
Market Overview: Crude Oil Futures The market formed a large Crude oil wedge bear flag on the weekly chart. The bears must create strong follow-through selling, trading far below the 20-week EMA and the August 13 low to increase the odds of testing the trading range low. The bulls want a reversal from a large […]
If you are not seeing the latest Weekly Report below, your PC/device browser is likely showing you an earlier page copy. Simply refresh your browser. For PCs you can use the F5 key, or Ctrl-F5, several times if needed.
Weak Weekly EURUSD Breakout
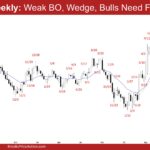
Market Overview: EURUSD Forex The market formed a weak weekly EURUSD breakout above the July 1 high. The bulls need to create strong follow-through buying trading above the July 1 high to increase the odds of a resumption of the trend. The bears want a reversal from a higher high major trend reversal and a […]
Bitcoin in Sideways Trading Range

Market Video Report: Bitcoin Futures Duration 10 mins. AI is voicing Josep Capo’s original script. Summary Analysis of Bitcoin’s weekly and daily charts. The weekly chart shows sideways trading, balancing the market after a bull cup-and-handle breakout. On the daily chart, price is in the middle of a trading range decreasing its velocity, suggesting a […]
Nasdaq 100 Pair of Good Bull Bars Ending 9-15
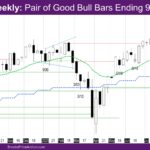
Market Overview: NASDAQ 100 E-mini Futures The NASDAQ E-mini futures week is another good bull bar with minimal tails, making it a pair of good bull bars ending 9-15. The daily chart is a tight bull channel and another couple of bull legs up this week. The month is a good bull bar so far. […]
Nifty 50 Bull Flag
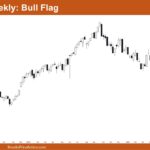
Market Overview: Nifty 50 Futures Nifty 50 Bull Flag on the weekly chart. This week, the market closed with a weak bullish finish, leaving a tail at the top. It is currently trading within a channel that also acts as a bull flag. The market is moving near the top trend line of this channel. […]
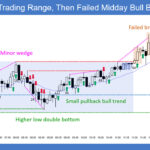
E-Mini Likely to Get Pullback After Failed Breakout of 6,700
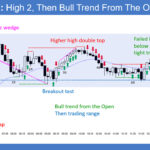
Trading Update: Friday September 19, 2025 S&P E-mini market analysis E-mini daily chart E-mini 5-minute chart and what to expect today Yesterday’s E-mini setups Al created the SP500 E-mini charts. Here are reasonable stop entry setups from yesterday. I show each buy entry bar with a green arrow and each sell entry bar with a […]
Emini 6,700 Likely to Become Resistance
Trading Update: Thursday September 18, 2025 E-mini end of day video review Follow Joseph’s YouTube channel for more Al Brooks price action analysis. S&P E-mini market analysis E-mini daily chart E-mini 5-minute chart and what to expect today Yesterday’s E-mini setups Al created the SP500 E-mini charts. Here are reasonable stop entry setups from yesterday. […]
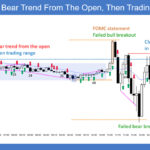
E-mini Bears Want Reversal Down Following FOMC
Trading Update: Wednesday September 17, 2025 E-mini end of day video review S&P E-mini market analysis E-mini daily chart E-mini 5-minute chart and what to expect today Yesterday’s E-mini setups Al created the SP500 E-mini charts. Here are reasonable stop entry setups from yesterday. I show each buy entry bar with a green arrow and […]
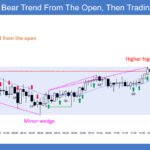
Emini Profit Maximization by Bulls
Trading Update: Tuesday September 16, 2025 S&P E-mini market analysis E-mini daily chart E-mini 5-minute chart and what to expect today Yesterday’s E-mini setups Al created the SP500 E-mini charts. Here are reasonable stop entry setups from yesterday. I show each buy entry bar with a green arrow and each sell entry bar with a […]
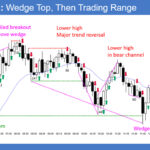
E-Mini Likely to Find Profit Taking This Week
Trading Update: Monday September 15, 2025 E-mini end of day video review S&P E-mini market analysis E-mini daily chart E-mini 5-minute chart and what to expect today Friday’s E-mini setups Al created the SP500 E-mini charts. Here are reasonable stop entry setups from Friday. I show each buy entry bar with a green arrow and […]

