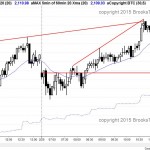
Posted 7:08 a.m. The Emini triggered a nested 60 minute wedge short on the open, but the selloff had small bars with tails. This was more likely a bear leg in a trading range than in a bear trend. Today will probably have an early trading range, like almost every day for 3 weeks has […]
If you are not seeing the latest Weekly Report below, your PC/device browser is likely showing you an earlier page copy. Simply refresh your browser. For PCs you can use the F5 key, or Ctrl-F5, several times if needed.
Intraday market update, February 25, 2015:
Intraday market update, February 24, 2015:
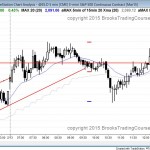
Pullback in a buy climax
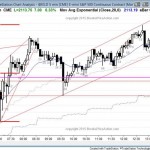
Posted 6:46a.m. The Emini has had tight trading range trading and a limit order market for the first hour or so for most of the opens over the past several weeks, and today is another example. After an extreme buy climax on the 5 minute chart and 9 consecutive bull bars on the daily chart, […]
Intraday market update, February 23, 2015:
Pullback after a buy climax
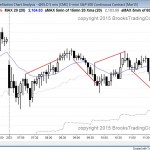
Posted 6:55 a.m. After 8 consecutive bull trend days, today will probably close below its open. However, it could be a doji day with swings up and down. Yesterday was a buy climax in a bull channel so there is a 70% chance of a 2 hour correction today. Although the Emini had a selloff […]
Emini weekend update, February 21, 2015:
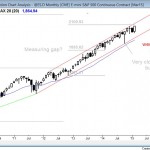
Bull breakout but the bull trend is overbought
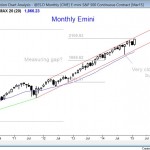
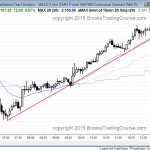
Monthly S&P500 Emini candle chart: Bull breakout but the bull trend is overbought The monthly Emini candle chart is in a tight bull trend channel, just below a measured move target and the top of the trend channel. The monthly S&P500 Emini candle chart has an outside up month in a tight bull trend channel. […]
Intraday market update, February 20, 2015:
Possible bear trend day
Posted 6:55 a.m. The Emini reversed down strongly from a test of the 60 minute moving average and became always in short on the 2nd bar of the day. The odds are that today will be a bear trend day, but it still might become a trading range day. Less likely, it would become a […]
Intraday market update, February 19, 2015:
Pullback to test support
Posted 6:57 a.m. The Emini reversed up from below yesterday’s low and formed a 2 day high 2 buy setup. If the bulls are able to rally to a new high, the rally will probably fail and create a final flag top. This would create a bigger pullback. The bears are hoping that this 2 […]
Intraday market update, February 18, 2015:
Buy climax and trend exhaustion
Posted 6:53 a.m. Today gapped below the trading range and reversed up from the bull trend line. However, it did not yet reach the 60 minute moving average and it has not yet broken above yesterday’s trading range. Both of these increase the chances of a test down today. If the bulls can break strongly […]
Intraday market update, February 17, 2015:
Posted 6:54 a.m. The Emini opened in the middle of yesterday’s range, and yesterday was a trading range day. Most of the days of the past several weeks began with a tight trading range that lasted about an hour, and today is similar. The gap down might be all of the correction that the bears […]
Emini weekend update: February 14, 2015:
Bull breakout and trend resumption
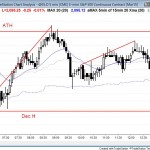
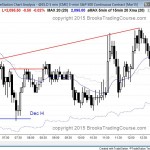
Monthly S&P500 Emini candle chart: Bull breakout and trend resumption The monthly Emini candle chart broke out to a new all-time high, but it is at the top of the channel and it is overbought. The monthly S&P500 Emini candle chart had a bull breakout and trend resumption. It broke below an ioi sell signal […]
Intraday market update, February 13, 2015:
Double top or bull breakout
Posted 6:55 a.m. The Emini broke above the top of the bull channel on the open and it formed a new all-time high. However, the rally lacked consecutive big bull trend bars. Also, yesterday was in a tight channel for 4 hours, and that is extreme behavior. Although the Emini is always in long, it […]

