Market Overview: Nifty 50 Futures
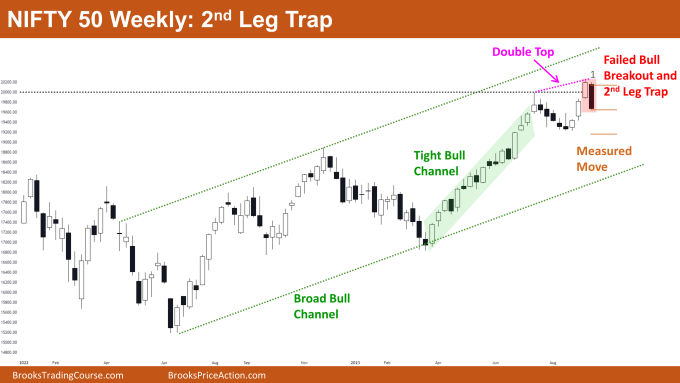
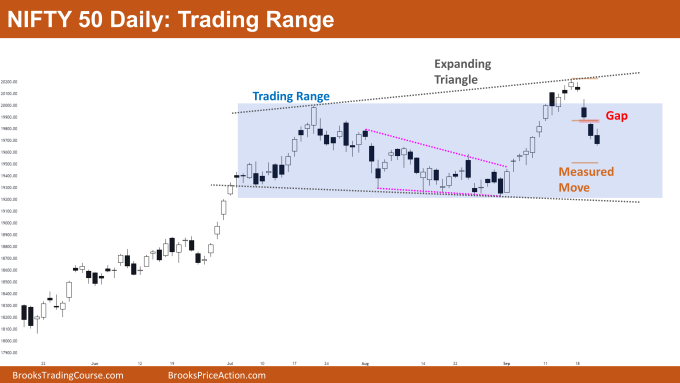
Nifty 50 2nd Leg Trap on the weekly chart. This week, the bears were able to obtain a strong bear close; however, a reversal will require a strong follow-through bar. Many bulls would be dissatisfied and postpone purchasing this bull breakout until the market once more gives a strong close above the all-time high. On the daily chart, the Nifty 50 is trading within a trading range. The market finally fell below the 20000 level after bulls were unable to produce strong bull closes above the big round number (20000 level).
Nifty 50 futures
The Weekly Nifty 50 chart

- General Discussion
- Because the market is trading inside of a broad bull channel, traders should buy near the channel’s low and sell near its high.
- Bulls should hold off on buying until the market closes strongly above the 20000 level or above the all-time high.
- Bears can sell the second leg of the bull trap with a tight stop loss. If the bears are unable to provide a strong bear follow-through bar, the likelihood of a tight trading range will increase.
- Deeper into the price action
- A second leg bull trap frequently results in a double top, as seen in the chart above. Bears’ ability to provide a strong follow-through bar would increase the likelihood of a reversal.
- Due to the strength of the bull trend, a weak bear follow-through bar may only produce a tight trading range rather than a reversal.
- Patterns
- Bar 1 is a surprise bear bar because it came right after a strong bull breakout and two consecutive bull bars.
- The surprise bar might lead to a measured move down based on the body of the surprise bar.
The Daily Nifty 50 chart

- General Discussion
- The market is currently trading in the middle of the trading range.
- The likelihood of a second leg down is higher as a result of the failed bull breakout. Bears can therefore sell on a low-1 signal bar.
- Bulls should hold off until the price is close to the trading range’s bottom.
- Deeper into price action
- After the bulls failed to obtain follow-through bull bars, the bears began to sell the bear closes, which resulted into bear gaps.
- Bears were able to get a bear gap and this might lead to a measured move down.
- Bulls anticipated a second leg up following the strong breakout of the trading range, but they were unable to hold above the 20000 level.
- Many bulls would have bought the closes of the bull breakout bars and now they are trapped (this is a 2nd leg bull trap).
- The likelihood of reaching the trading range bottom will increase if the bulls are unable to close the bear gap.
- Patterns
- The market has now re-entered the trading range following the failed breakout attempt, so traders should use the buy low, sell high trading strategy.
- An expanding triangle pattern is also developing in the market. The trading range bottom or the bottom trendline of the expanding triangle are the targets for sellers who enter at a low-1.
Market analysis reports archive
You can access all weekend reports on the Market Analysis page.

