Market Overview: Nifty 50 Futures
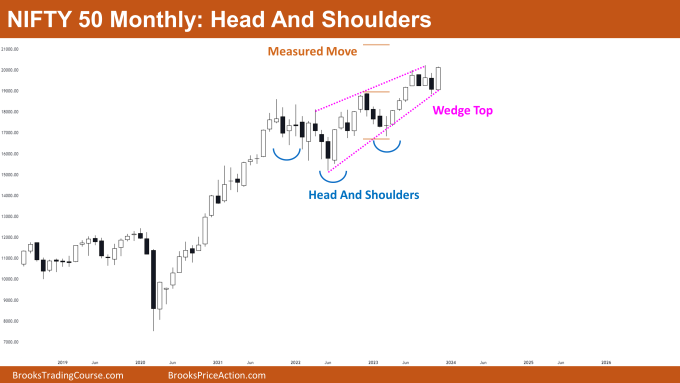
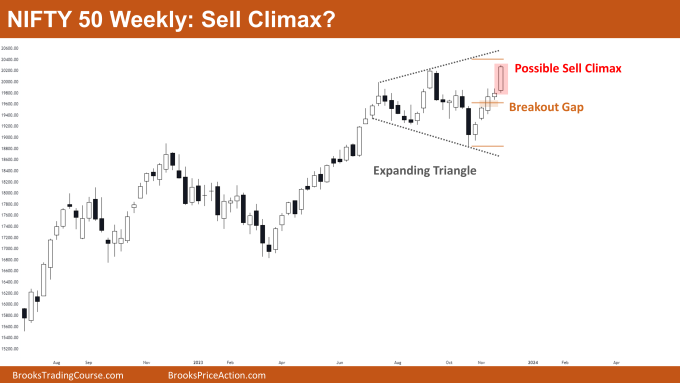
Nifty 50 Head and Shoulders on the monthly chart. The Nifty 50 made a strong bull bar and closed close to its high this month. It is currently trading close to the wedge-top pattern’s top. Bulls may expect this trend to continue until the measured move is reached, as the Nifty 50 has already shown a bull breakout of the head and shoulders. On the weekly chart, the Nifty 50 has also created a robust bull bar that closed close to the high, and the market is presently trading close to the top of the expanding triangle pattern. Be aware that large, strong bull bars near the end of a bull trend may indicate a sell climax rather than a continuation of the trend.
Nifty 50 futures
The Monthly Nifty 50 chart

- General Discussion
- Since the bears were unable to reverse and produce a bear breakout of the wedge top, bulls who were already holding long positions shouldn’t sell.
- Until the market exhibits a strong bear breakout of the wedge top, bears shouldn’t be selling.
- Traders without any open positions may proceed long with a modest stop-loss and a target.
- Deeper into the price action
- Over the previous ten bars, bulls were able to create strong, consecutive bull bars, while bears were unable to create strong, consecutive bear bars.
- This suggests that there is a significantly lower likelihood of a strong and successful bear breakout than there is of a strong bull breakout of the wedge top.
- Patterns
- A trader can exit out of a head and shoulders pattern at either of the following two levels. First, get out of the market when the move reaches the measured move equal to the shoulder height. If the market continue to exhibit strength, traders will wait until the market reaches the measured move that corresponds to the head’s height.
- The likelihood of a tight trading range near the top of the wedge-top pattern would rise if bulls are unable to produce a strong follow-through bar.
- A wedge top has a 25% chance of a successful bull breakout, meaning that 75% of wedge top bear breakouts are successful.
The Weekly Nifty 50 chart

- General Discussion
- Bulls with long positions may hold them until the market makes strong consecutive bear bars or reaches the breakout gap measured move.
- Bears shouldn’t sell until the market forms a strong bear bar, even though the strong bull bar may be a sell climax.
- Deeper into price action
- The market is heading sharply upward in the expanding triangle, indicating a possible sell climax.
- There is a good probability of a narrow trading range preceding a breakout whenever the market moves sharply in the direction of an important level (such as the top or bottom of a trading range, a channel, an expanding triangle, or measured moves).
- Take note that bears may begin selling in anticipation of a reversal and bulls must liquidate their positions if a strong bear bar follows a strong bull bar.
- Patterns
- The market is getting closer to both the expanding triangle’s high and the breakout gap measured move target.
- Based on the height of the strong bull bar, bears can anticipate a measured move lower if a strong bear bar follows the bull bar.
Market analysis reports archive
You can access all weekend reports on the Market Analysis page.

