Market Overview: DAX 40 Futures
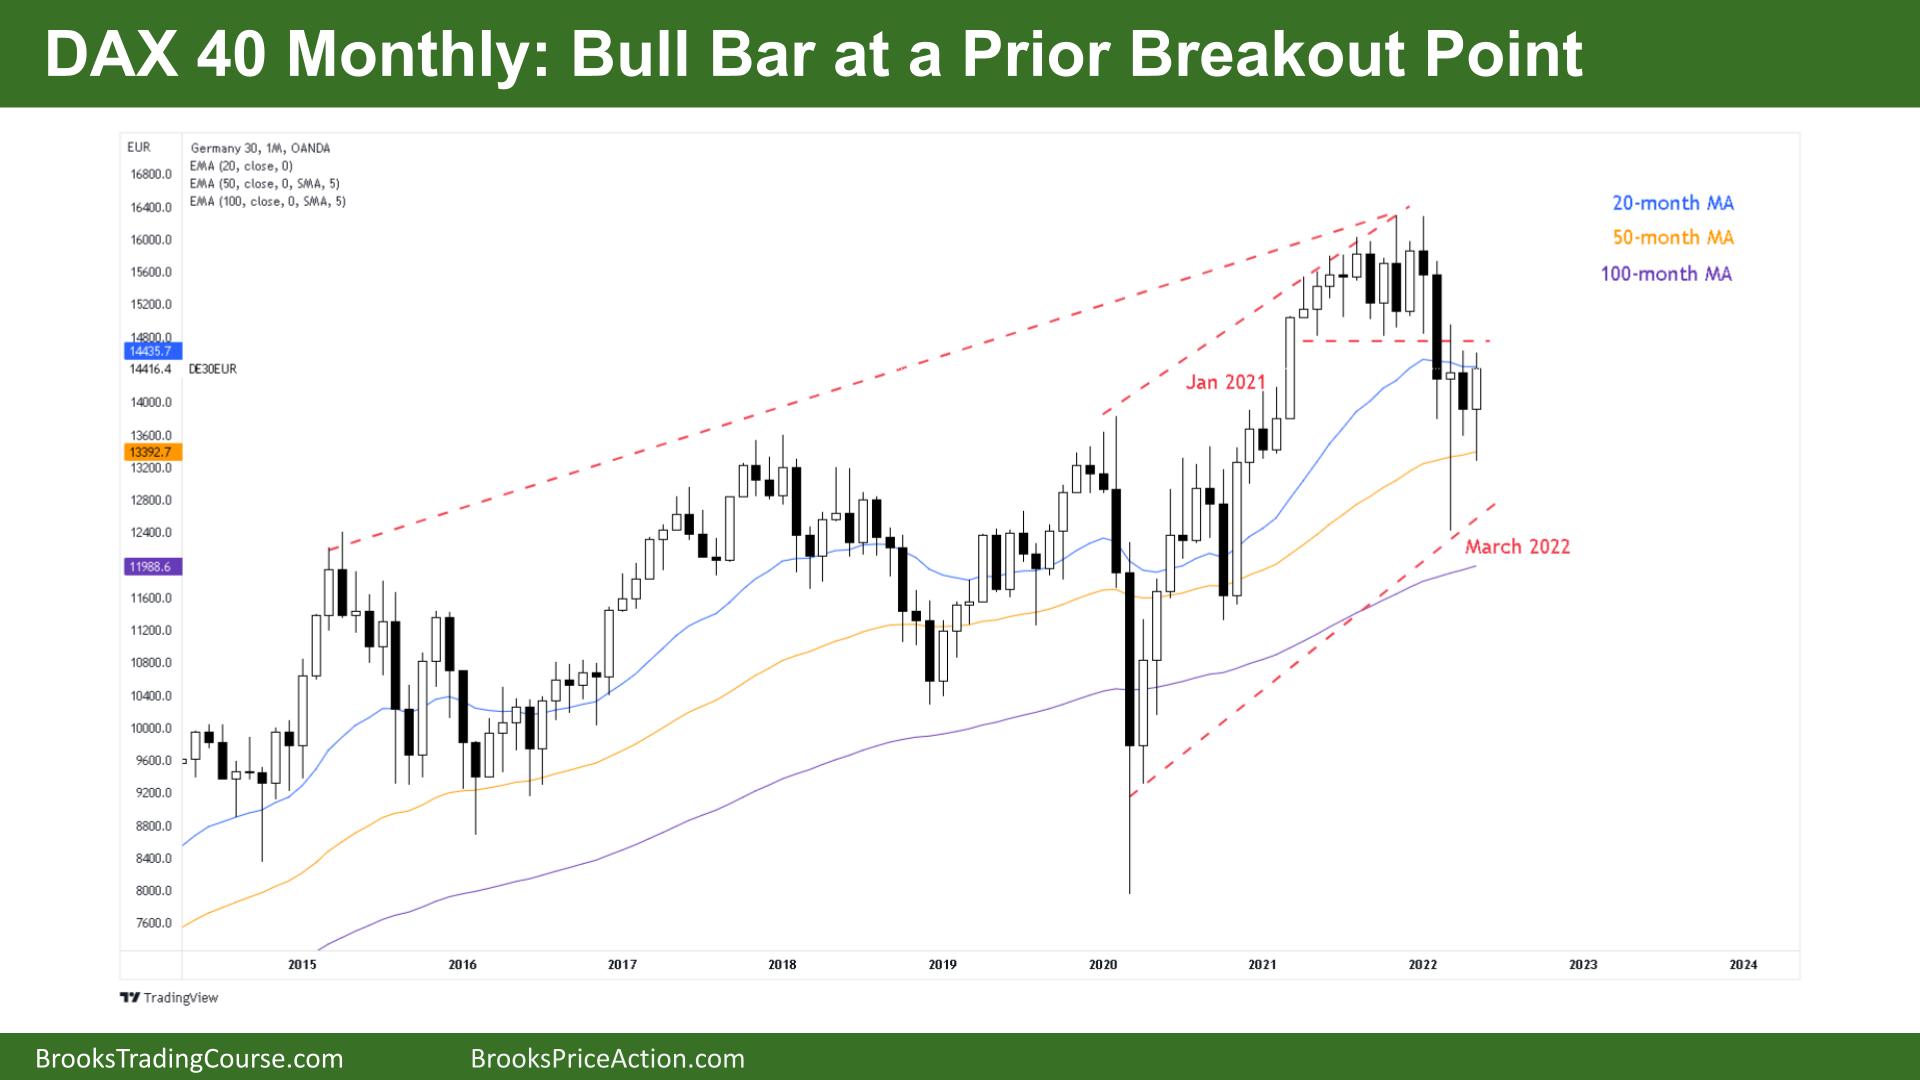
DAX futures was a bull bar at a prior breakout point and at the moving average. It’s a tight trading range on the lower timeframes as traders decide where we are going. The bulls see a weekly major trend reversal and a developing small pullback bull channel. The bears see we have multiple prices for possible double top sells. This trading range behavior will likely lead us sideways with a possible inside bar next month.
DAX 40 Futures
The Monthly DAX chart

- The Dax 40 futures was a bull bar at a prior breakout point of January 2021.
- We traded below April but closed above it with a small tail on top suggesting indecision by traders. We closed at the 20-Month moving average (MA)
- For the bulls, it is a High 1 at the moving average which is a reasonable buy signal.
- April was the first moving average gap bar (a bar completely below the moving average) since May 2020. As bulls have been happy to pay above-average prices for 2 years we could have expected them to buy here.
- Bulls bought below the bars, not above, suggesting limit order trading and scale in bulls. They see a two-legged pullback from a two-year bull trend and might want a high 2 stop entry to buy to get long again.
- The bears see a failed breakout above a final flag, a tight trading range at the end of the trend and a measured move lower. They see we are stalling at the prior breakout point at January 2021.
- We have spent 4 months around this price, it could be the middle of a developing trading range so we can expect sellers above bars and buyers below bars, this remains true.
- The bulls want a strong follow-through bar to convince traders we will go higher. It is a major trend reversal on a lower timeframe. They see a double bottom with March and the bull Bar at a prior breakout point, so they need confirmation.
- The bears see that the second leg down has not been completed yet and there will be sellers above the high of prior bars so expect sideways to down.
The Weekly DAX chart

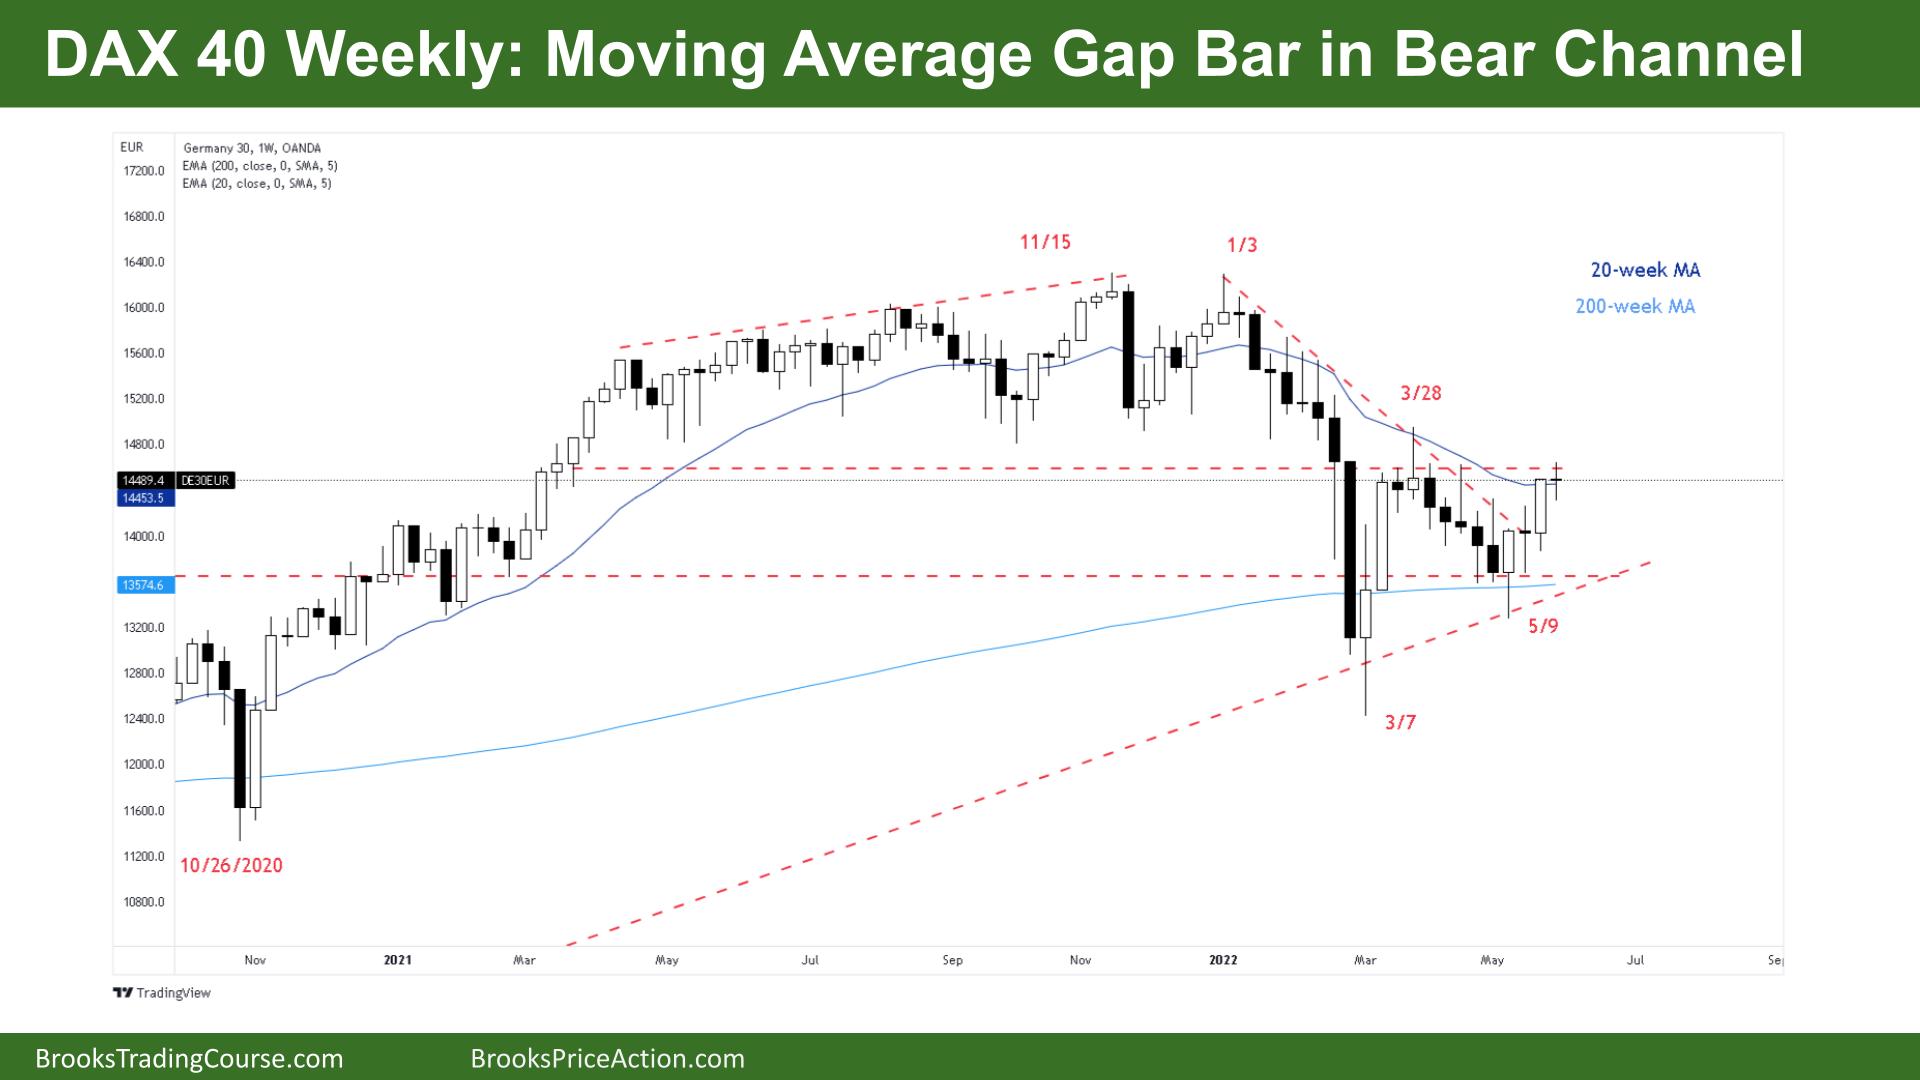
- The Dax 40 futures weekly chart bar was a small bear doji and a moving average gap bar in a bear channel
- It was a pause bar at the moving average after a strong bull breakout suggesting it is not as bullish as it could be.
- The bulls see a higher low double bottom / major trend reversal off the 200-week moving average. They see a High 3, wedge breakout and we respected the prior breakout point below as support.
- The bulls see a final break through the bear channel and now we are testing the prior breakout point above. Will it be resistance?
- The bears see a broad bear channel becoming a trading range and expect the best the bulls can get here is a bull leg in a developing trading range.
- The bulls might buy a Low 1, but at the top of a trading range, it is a more reliable sell signal, not a buy.
- The bears want to sell a Low 1 or Low 2, but after 2 very strong bull bars they might sell above bars instead and scale in.
- Traders have been selling below the average price for 20 weeks, so we can expect sellers to come in at this price – but they haven’t yet.
- Look left, this is the 3rd week in 3 months where we have had a small doji at this price level. That tells us we have a tight trading range, an area of agreement and this is now a magnet for any trading to come back to.
- The bears want an outside-down bar to check there aren’t any buyers above before a stop entry sell to move back down to the May 9th lows. A strong bear close would be ideal for them.
- Even with a strong bear bar, the bulls might see it as a breakout pullback test of the trend line.
- If we get another doji next week, with a higher close that is good for the bulls. Then traders will expect two legs from the double bottom. Bears might not sell again until the March 28th high.
- If you look back on the chart to when we had bull bar – doji – bull bar – doji, it moved into a trading range. So sideways to up is more likely next week.
Market analysis reports archive
You can access all weekend reports on the Market Analysis page.