Market Overview: NASDAQ 100 E-mini Futures
The NASDAQ E-mini futures week is a smaller bear bar with first close since April below EMA – exponential moving average. It is a pair of bear bars at support – weekly EMA, like the pair of bear bars in March at the monthly EMA.
The daily chart bounced off the weekly EMA early in the week and then sold off to close below it.
The monthly bar is a bigger bear bar near the close of April/open of May, which is not far away (See explicit green line on daily chart).
NASDAQ 100 E-mini futures
The Weekly NASDAQ chart
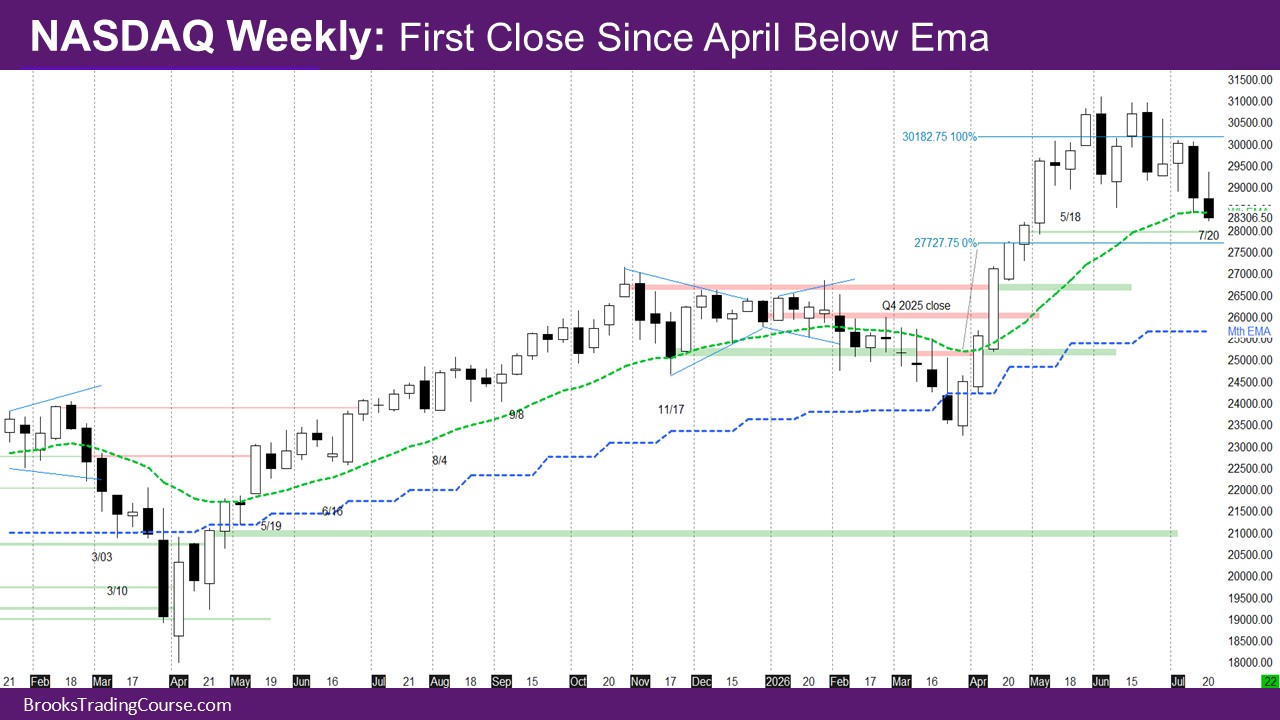
- The week is a smaller bear bar with close below the weekly EMA, and a prominent tail at top that indicates buyers at first followed by sellers.
- This is the first close below EMA since early April, and the first pair of bear bars since March.
- Just like March, when the pair of bear bars were at support – the monthly EMA, this pair of bear bars is also at support – the weekly EMA.
- So the question now is – will this pair of bear bars also act like a final leg in the pullback to the EMA?
- Reports since May have said that the close of April/May should be a magnet and should find intermittent support. The market is close enough that it should reach there next week.
- The reason for the intermittent support is that there were likely sellers at the close of April, a really big bull bar, not expecting good follow-through. The sellers were trapped when May also closed as a strong bull bar.
- Another reason for support is the theory that bulls are waiting to buy a pullback after April and May. Well, this gives the bulls a good opportunity to buy.
The Daily NASDAQ chart
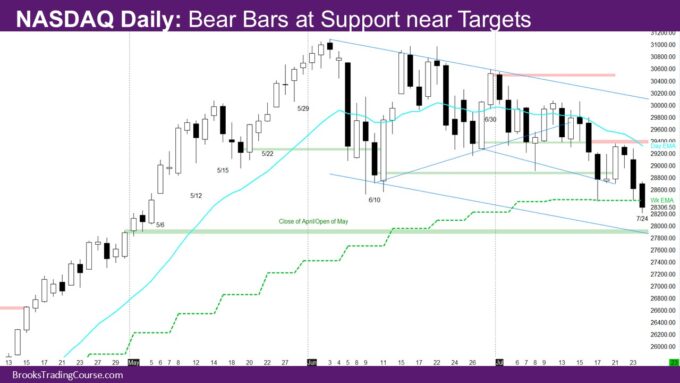
- Prior week’s report said that last Thursday and Friday were a pair of good bear bars, such that it is likely for at least a small second leg down.
- The report also said it was likely for this week to bounce between the weekly and daily EMA.
- Monday is a doji bull bar, followed by a strong bull bar on Tuesday.
- The market is now close to the area that was prior support over the past couple of weeks, and that was broken by the bear bars of last Thursday and Friday.
- The question now is whether there is one more bull bar, or a tail going to the EMA.
- Wednesday is an inside bear bar with enough of a tail below to make it a bad sell signal bar.
- Despite that, Thursday and Friday are a pair of good bear bars with Friday closing below the weekly EMA.
- Thursday and Friday are good enough bear bars that there should at least be a small second leg down.
- Keep in mind, the small leg down could be a single bear bar, or the tail below a bar.
- As mentioned earlier, the close/open of April/May is just below, as is the channel line of the channel down. So, it is likely for the market to reach there and bounce.
- It is also likely that if there is a bounce, it will be big bull bars, which usually find profit-takers sooner, leading to more trading range price action.
Market analysis reports archive
You can access all weekend reports on the Market Analysis page.


