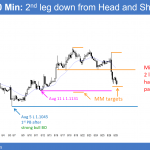
September unemployment jobs report breakout Updated 6:48 a.m. The Emini has sold off for 8 days and yesterday reversed up from the bottom of the month-long trading range. It also rallied on the unemployment report before the open today. While it gapped up on the open, it formed doji bars just below the August 29 […]
September unemployment jobs report breakout
September unemployment report and Federal Reserve interest rate hike
Intraday market update: September 1, 2016
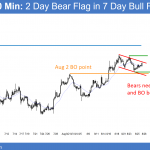
September unemployment report and Federal Reserve interest rate hike Updated 6:50 a.m. The Emini stalled at the 60 minute moving average and the top of yesterday’s tight trading range. This is trading range price action. Yesterday’s 3 hour bull channel is a bear flag. Therefore, there is only a 25% chance of a strong bull […]
September 2016 stock market correction
Intraday market update: August 31, 2016
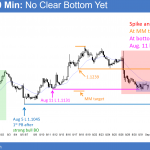
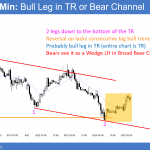
September 2016 stock market correction Updated 6:56 a.m. The Emini opened with a tight trading range just above yesterday’s low and the open of the month. This is a breakout mode setup. Because the Emini was unable to reverse strongly above the open of the month yesterday and did not reach the open of the […]
End of month and unemployment report stock market catalysts
Intraday market update: August 30, 2016
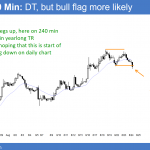
End of month and unemployment report stock market catalysts Updated 6:57 a.m. Because today might be a 2nd inside day, traders sold the early test of yesterday’s high. This was a lower high major trend reversal, but there was no good sell signal bar and no strong bear breakout. The bulls want to get above […]
August bear reversal bar
Intraday market update: August 29, 2016
August bear reversal bar Updated 6:51 a.m. The Emini rallied on the open and broke above the 60 minute moving average and the 50% pullback level. Yet, the 1st 2 bars had prominent tails and the 3rd bar was a small bar. This reduces the chances of a big bull trend day. The bulls need […]
Yellen Fed interest rate hike announcement
Intraday market update: August 26, 2016
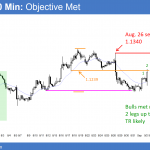
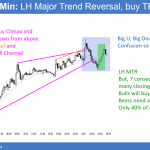
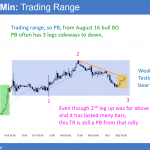
Yellen Fed interest rate hike announcement Updated 7:11 a.m. The Emini broke above the 3 day tight bear channel on the open. It sold off sharply on Yellen’s remarks, and then reversed up to a new high of the day. This Big Up, Big Down, Big Up trading creates confusion. It therefore increases the chances […]
Emini double top at 2200 resistance
Intraday market update: August 25, 2016
Emini double top at 2200 resistance Updated 6:57 a.m. The Emini reversed up from below yesterday’s low and from 1 tick below the open of the month. Yet, because the 2 day selloff was in a tight bear channel, the odds are that this reversal up will be a bull leg in a trading range. […]
Greater fools theory crowded trade
Intraday market update: August 24, 2016
Greater fools theory crowded trade Because I will not be trading today, I will be unable to provide an update. Pre-Open Market Analysis The Emini made a new high again yesterday and formed a 5 day island bottom. However, there was no enthusiasm. The day was small and sideways. While yesterday was an entry bar […]
Emini island bottom bull breakout
Intraday market update: August 23, 2016
Emini island bottom bull breakout Updated 6:46 a.m. While the Emini gapped up to a new high and formed an island bottom, the breakout was weak. The Emini is Always In Long, and the bulls still want a bull trend day. Yet, these 1st few bars make a strong bull trend day less likely. More […]
S&P500 stock market wedge rally buy climax
Intraday market update: August 22, 2016
S&P500 stock market wedge rally buy climax Updated 6:56 a.m. The Emini sold of on the 1st bar to test yesterday’s low. Yet, this was followed by a pair of dojis and a 4 bar tight trading range. Limit order bulls and bears made money in the 1st few bars. Hence, these are signs that […]

