
US equities and futures market early close With the Juneteenth US federal holiday and market early close on Friday June 19, 2026, there will be no daily Emini report for today. Brad will be back with his daily report on Monday June 22, 2026. Wishing you and your family a safe and wonderful break.
MoneyShow X11 Outreach Group SCAM

WhatsApp Group SCAM Featuring Al Brooks! A significant number of aspiring traders/investors have been scammed by this WhatsApp group posing as a MoneyShow service supported by IKBR broker. The service features daily investment tips from their Chief Analyst Al Brooks!! Needless to say this is a pure 100% scam, so please be very careful of […]
«Down to basics» and Coaching Introduction Webinar Video

Video duration 2hr 12min – Presented Saturday August 16, 2025 11am – 1pm PT This first webinar was open to all, and covers a «Down to basics» price action presentation followed by a discussion of the process involved in coaching sessions. Coaching sessions for Orlando 2024 attendees and 2025 registrants will follow on the next three weekends. Separate emails […]
Good Friday holiday: No market report

US equities and futures markets closed With the Good Friday market holiday on Friday April 18, 2025, the markets are closed. Therefore there will be no daily Emini and Forex report for today. Weekend reports will be issued as normal Saturday and Sunday. Brad will be back trading with the daily report on Monday April […]
Al Brooks in Brazil — April 6, 2024

Join Al Brooks in São Paulo, Brazil On April 6th, São Paulo will host an unmissable event. «Trading Masters – Veteran Traders Share Techniques and Principles That Can Change Your Results». Felippe Aranha will welcome Al Brooks (recognized as «The Best Price Action Authority in the World») and prominent figures from the Brazilian trading scene, […]
Nifty 50 Bull Flag
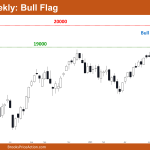
Market Overview: Nifty 50 Futures Nifty 50 Bull Flag on the weekly chart. On the weekly chart, the market formed a strong bull bar following an unsuccessful attempt at a reversal. Bulls gave a bull breakout of the bull flag, and based on the height of the bull flag, this could cause a measured move […]
Nifty 50 Trading Range Price Action
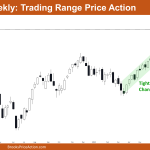
Market Overview: Nifty 50 Futures Nifty 50 Trading Range Price Action on the weekly chart. This week, the market created a small bear bar that closed close to its low and an inside bar pattern that could signal a gradual decline. The tight bull channel in which the weekly is still trading makes it more […]
Nifty 50 Outside Bar on Weekly
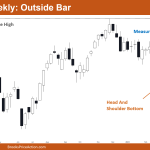
Market Overview: Nifty 50 Futures Nifty 50 outside bar on weekly chart where the market created a bear doji bear this past week. It is currently trading inside a tight bull channel. Measured move of the head and shoulder bottom and the all-time high could be acting like a magnet for the price. The daily […]
FTSE Head and Shoulders Top or High 1 Buy?
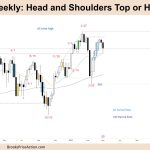
Market Overview: FTSE 100 Futures The FTSE futures market formed a possible FTSE head and shoulders top on the weekly chart. The bulls want a High 1 buy above the pullback, but they might wait for a better entry bar. The bulls want a strong close or double bottom above the prior trading range high from […]
Nifty 50 Tight Bull Channel
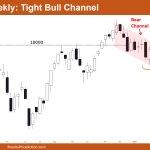
Market Overview: Nifty 50 Futures Nifty 50 tight bull channel on the weekly chart. Bulls were unable to create a strong follow-through above the big round number 18000, and bears on the weekly chart will stay away from selling until the market develops another strong bear bar. This week, the market formed a bear bar that […]

