Gold GC-Mini Market Analysis
The Gold GC-mini weekly chart is trapped in a trading range near the $4000 level, showing persistent breakout pressure but a lack of follow-through. Bulls are attempting to form a double bottom to secure higher lows, while bears printed decisive consecutive red bars
wanting to continue prices downward.
Bulls want $4000 to be the line in the sand. Bulls are trying to prevent the market from running away to the downside while still in correction mode after the historic parabolic spike to all time highs. Weekly bears created a lower low in respect to where the body is closed, however the bears were unable to put in a lower low as far as tails are concerned.
In a first, On Thursday daily bears were able to close a bar beneath the psychologically significant $4000 mark. On Friday bears failed to follow through on that achievement.
Look for Bears to continue to pound this stubborn support level in the coming week(s).
Gold GC-mini futures
The Weekly Gold chart
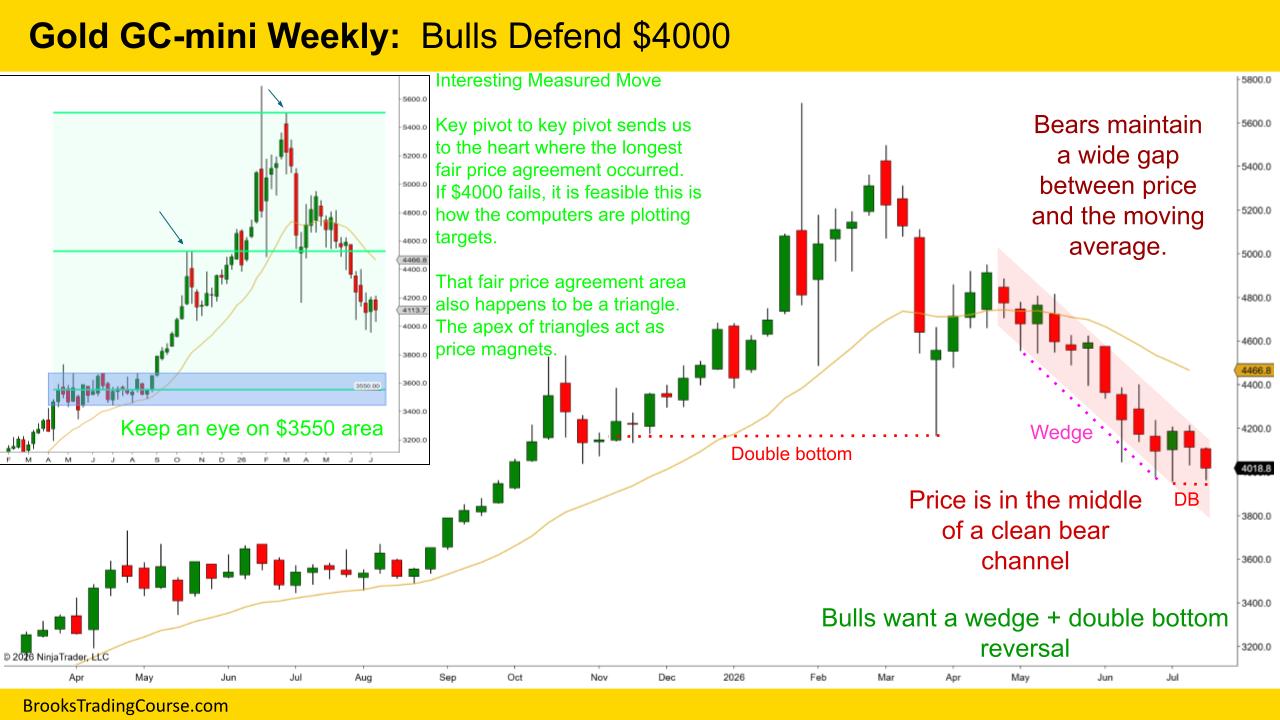
- Bears get follow through to the downside from last week’s bar.
- Bears are able to close a body beneath the bottom tail of the prior bar, a strong bear signal.
- The weekly bar did not close below the psychological 4000 mark.
- Tail beneath the past 4 bars show the presence and determination of Bulls to keep prices above 4000.
- 6 of the past 7 bars are bearish.
- Sideways range between 3950 – 4230 for the past 4 weeks.
- Always in short.
- Bulls want to protect the support level of 4000.
- Bears create a lower low body close.
- Bears do not create a tail lower low.
- Bears maintain a wide gap between price and the moving average.
- As time passes during a sideways market, the 200 moving average begins to close in.
- Bulls want a wedge + double bottom reversal pattern.
The Daily Gold chart
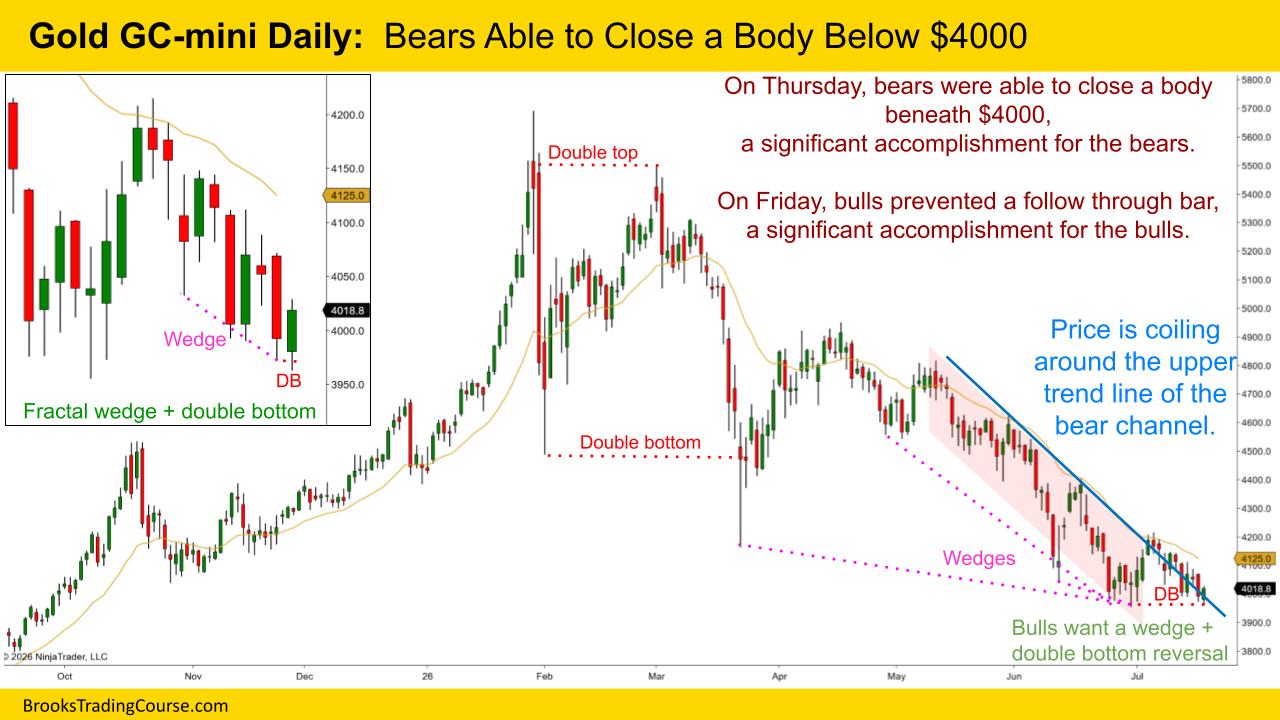
- Bear channel.
- 4 of the 5 days ventured under psychological 4000.4 of the 5 days ventured under psychological 4000.
- Thursday Bears succeeded for the first time in closing a body beneath 4000.
- Monday and Tuesday printed outside-inside bar sequence. A breakout pattern.
- Bulls able to close the body above 4000 on Friday.
- Crucial 4000 area support has not broken yet.
- Bears are in control.
- Bulls want a wedge double bottom reversal. This pattern is present in a larger context and in fractal smaller form.
- Bears maintain a wide gap between price and the moving average.
- Bulls want to establish firm support.
- Bulls want to close consecutive bars above the moving average.
- Bears want to continue to channel downwards while breaking 4000 with confidence.
- Bears have been successfully selling the moving average since April 22nd.
Market analysis reports archive
You can access all weekend reports on the Market Analysis page.


