Market Overview: S&P 500 E-mini Futures
The weekly E-mini bears need strong follow-through bear bars closing below the 20-week EMA to flip the market into Always In Short. If the market trades lower, bulls want the June 26 or June 9 lows or the 20-week EMA to act as support, forming a wedge bull flag.
S&P500 E-mini futures
The Weekly S&P 500 E-mini chart
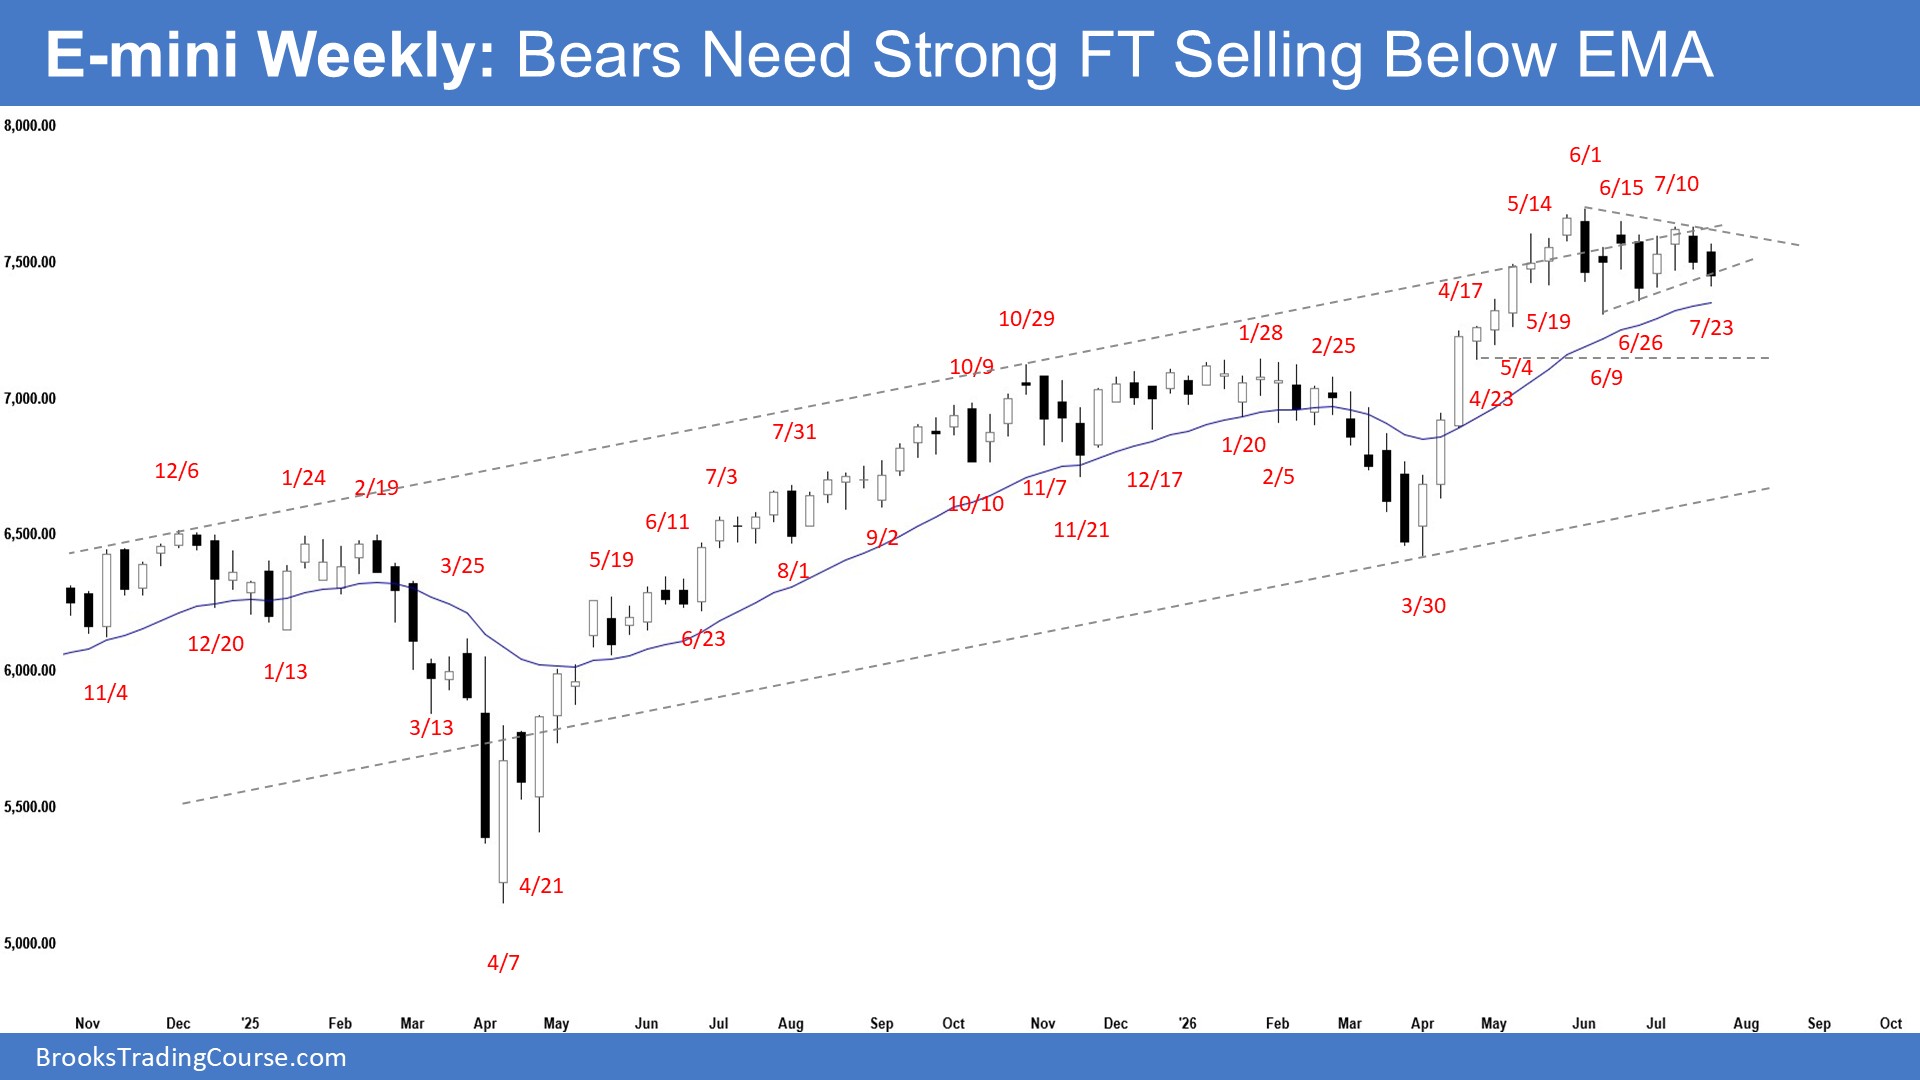
- This week formed a bear bar closing in its lower half with a small tail below.
- Last week, we said traders would watch whether bears could create a strong bear entry bar closing far below the 20-week EMA, or whether the follow-through selling would remain limited, followed by a retest of the June 15 high instead.
- Bulls want a measured move to around 8000, based on the height of the initial spike (from the March 30 low to the April 17 high).
- Bulls see the current move as pullback forming a wedge bull flag (June 9, June 26, and July 23).
- Bulls want the pullback to remain weak and sideways, lacking follow-through selling, with overlapping candlesticks and prominent lower tails.
- Bulls hope the pullback has alleviated the recent overbought conditions and want a retest of the all-time high.
- If the market trades lower, bulls want the June 26 or June 9 lows or the 20-week EMA to act as support, forming a wedge bull flag.
- Bulls need consecutive strong bull bars to show control.
- Bears want a test of the April 23 low or the bull trend line following the trend channel line overshoot.
- Bears want a reversal from a double top bear flag (June 15 and July 10) and a lower high major trend reversal.
- If the market trades higher, bears want the June 15 high to act as resistance, forming a wedge bear flag.
- If the market makes a new all-time high, bears see the current 7-bar sideways trading range as potentially the final flag of the rally.
- Bears need consecutive strong bear bars breaking decisively below the 20-week EMA to flip the market into Always In Short. Without that, traders will be reluctant to sell aggressively.
- The market broke above the trend channel line, followed by a sideways pullback in the last 7 weeks.
- Failed breakouts above a trend channel line can lead to a test of the bull trend line.
- However, if the pullback remains mostly sideways, with overlapping candlesticks and prominent lower tails, it can indicate strong bulls and increase the odds of trend continuation after the pullback.
- The market has formed a triangle pattern, meaning it is entering breakout mode.
- Bears created a decent bear entry bar this week, but the market remains in a sideways trading range above the 20-week EMA.
- Traders will watch whether bears can create more follow-through selling closing below the 20-week EMA.
- Traders will also watch whether the follow-through selling remains limited, with the market holding above the 20-week EMA, followed by a retest of the June 15 high in the weeks ahead instead.
- For now, the current pullback is likely to remain minor. However, if the bears can create consecutive bear bars closing near their lows, it could flip the market into Always In Short.
The Daily S&P 500 E-mini chart
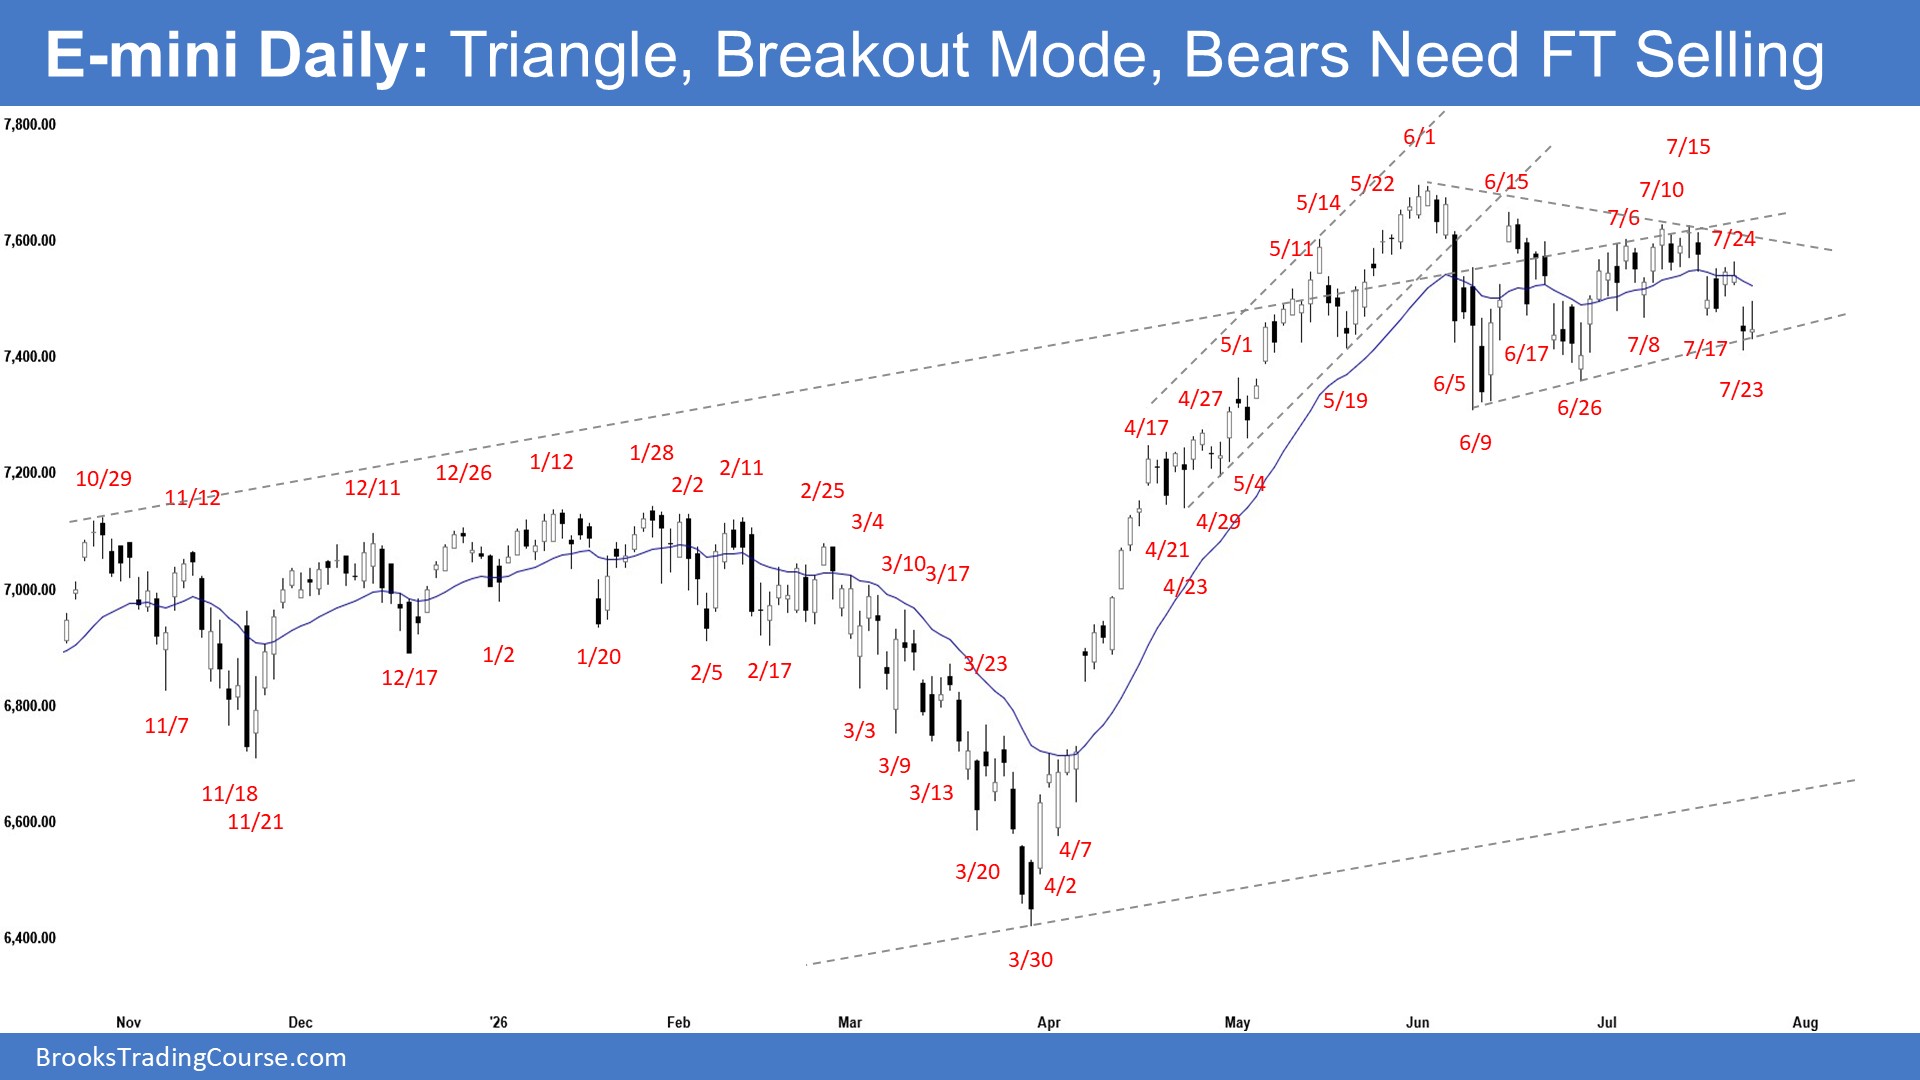
- The market tested the 20-day EMA in the first half of the week. Thursday gapped down, closing as a bear doji. Friday traded slightly higher but closed as another doji near its low with a prominent upper tail.
- Last week, we said traders would watch whether bears could generate strong bear bars to retest the June 26 or June 9 lows, or whether the pullback would remain weak and sideways, lacking sustained follow-through selling instead.
- The market traded slightly lower, but the follow-through selling is not yet strong.
- Bears want a retest of the April 23 low or the bull trend line following the trend channel line overshoot.
- Bears want a reversal from a double top bear flag (June 15 and July 10) and a lower high major trend reversal.
- If the market trades higher, bears want the June 15 high to act as resistance, forming a wedge bear flag.
- If the market makes a new all-time high, bears see the current sideways trading range as potentially the final flag of the rally.
- Bears need consecutive strong bear bars closing near their lows to flip the market into Always In Short. Without that, traders will be reluctant to sell aggressively.
- Bulls want a measured move to around 8000, based on the height of the initial spike (from the March 30 low to the April 17 high).
- Bulls view the current move as a pullback, forming a wedge bull flag (June 9, June 26, and July 23).
- Bulls want the pullback to remain weak and sideways, with overlapping candlesticks, bull bars, and prominent lower tails.
- Bulls hope the pullback has alleviated the recent overbought conditions and want a retest and breakout above the all-time high.
- If the market trades lower, bulls want the June 26 or June 9 lows to act as support.
- Bulls need consecutive bull bars closing near their highs and breaking strongly above the all-time high to increase the odds of a trend resumption.
- The market traded sideways, forming a triangle pattern following the trend channel line overshoot. A triangle pattern indicates the market is entering breakout mode.
- A trend channel line overshoot can lead to a pullback to test the bull trend line.
- However, if the pullback is weak and sideways, it can indicate strong bulls and increase the odds of a trend resumption after the pullback.
- Traders will watch whether bears can generate consecutive strong bear bars breaking below the June 26 or June 9 lows, or whether the pullback remains weak and sideways, lacking sustained follow-through selling instead.
- If the market trades higher, traders will watch whether the follow-through buying is strong or weak, with overlapping candlesticks, prominent upper tails, and stalling around the June 15 high area.
- For now, the current pullback is likely to remain minor. However, if bears can generate consecutive strong bear bars closing near their lows, it could flip the market into Always In Short.
Trading room
Al Brooks and other presenters talk about the detailed E-mini price action real-time each day in the Brooks Trading Course trading room. We offer a 2 day free trial.
Market analysis reports archive
You can access all weekend reports on the Market Analysis page.


