The support forum is built with (1) General and FAQ forums for common trading queries received from aspiring and experienced traders, and (2) forums for course video topics. How to Trade Price Action and How to Trade Forex Price Action videos are consolidated into common forums.
Brooks Trading Course social media communities
Brooks Trading Course Learning Resources >>>

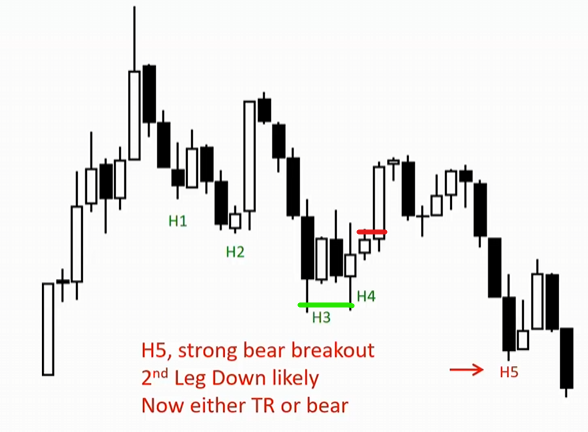
is the red line a good entry? if not why?
the reason I see:
1. Strong bull trend (context)
2. double bottom in h3 and h4 (stop also set here)
3. There is a fair good buy signal and another bull bar follow-through on h4
But why it reversal down at the end and if I buy at the redline, I wouldn't achieve my profit goal? (2x the loss)
Much appreciated!

To me, it looks like a reasonable entry. Not all reasonable entries work. In addition to what you note as a double bottom, it looks like a complex two leg pullback and the buy above the red line is a second entry long. You could put a stop below the green line and it looks like you could have made a scalp, or you could have held for new high. I think it would be reasonable to get out below the first bear bar in the bear spike which ended in the H5. And if a trader determined the entry was failing and bought under the H4, or at the close of the bull bar after the H5 it looks like you would have been able to break even or avoid a loss, which is usually the case when a reasonable entry is taken. But remember, not every reasonable entry works.

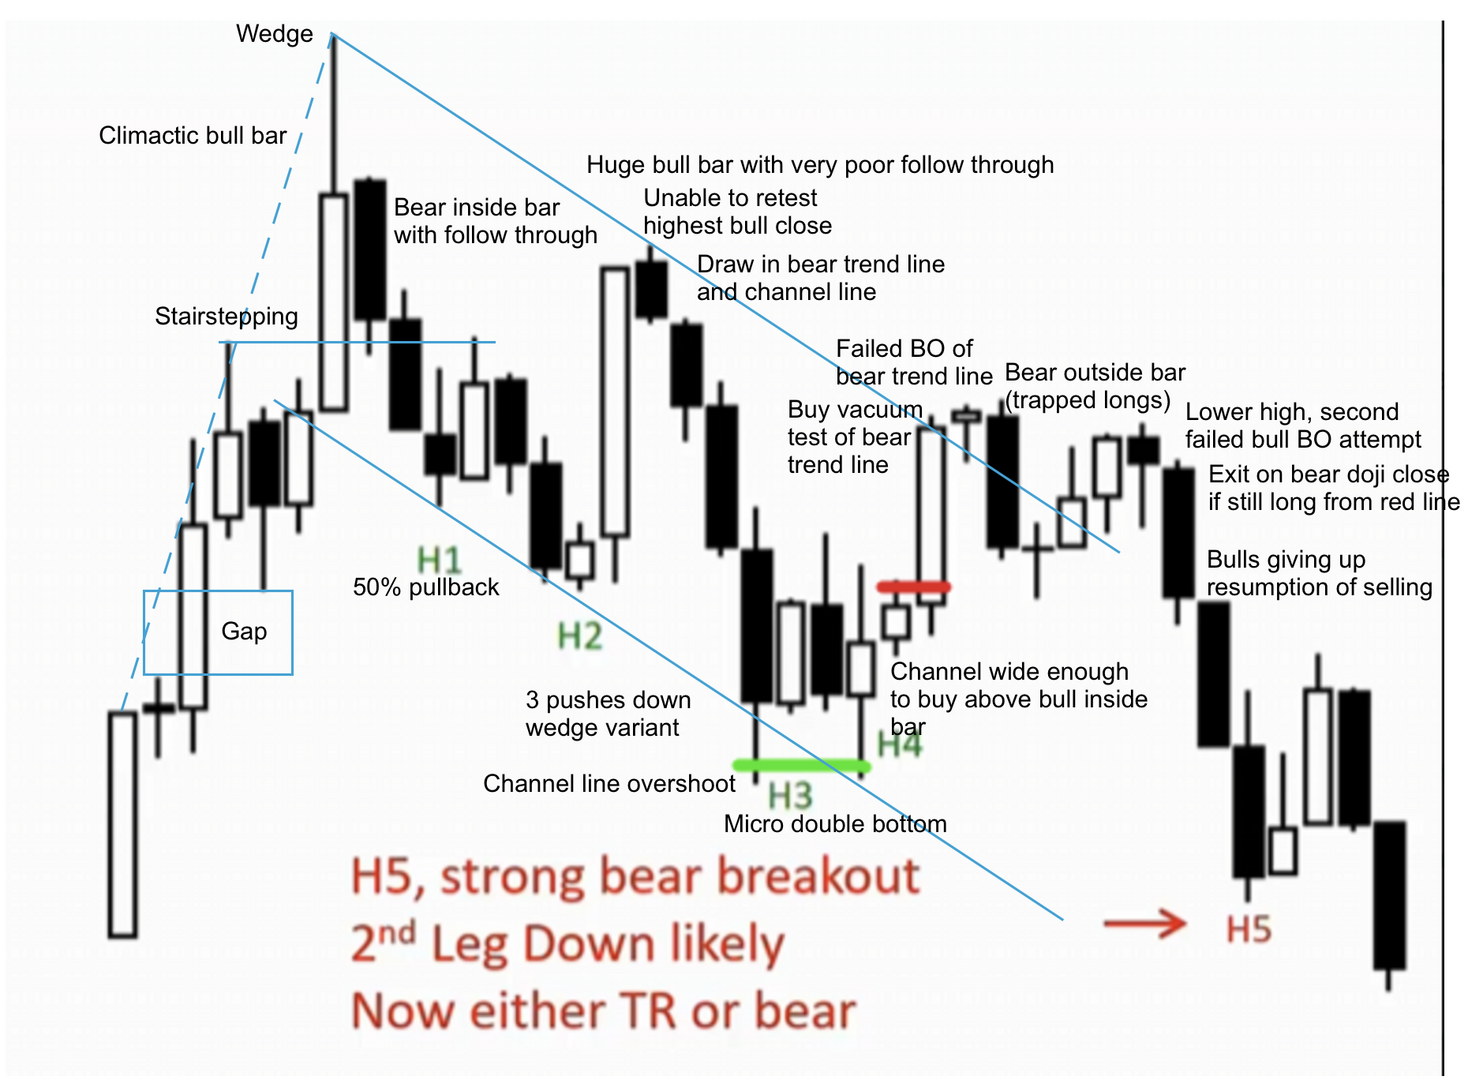
Short answer: yes, that is a good long entry.
Long answer: I've included annotations of the chart as a whole, there's more stuff on that chart worth pointing out but it was getting too cluttered. Read the commentary from the left side of the chart to the right side.
The initial bull move up was strong. There was a gap between the breakout point and the low of the bear bar after the second leg up. This momentum did wane to an extent though and we saw the bear inside bar near the top of the bull move (where there's a prominent tail above the bar) coming back down to retest the prior breakout point (stair stepping). This bull move forms a wedge - 3 pushes up.
The bears were strong enough to get a two-legged move down to approximately 50% of the bull move. The bulls had their strongest bar after that pullback, but that didn't have follow through buying. In this case, the technical stop was far away, the probability of more movement up was okay but the potential reward may have only reasonably been to the highest bull close - all in all this isn't a particularly good trader's equation. Consider also that bulls who were long from the initial bull move up and bears who had missed the sell off (that likely wound up being stronger than traders expected) would both be looking to sell the highs - lots of pent up selling pressure. So, in this case, it is reasonable to think that the size of that bull bar had more to do with bears waiting to sell aggressively until the prices came back up near the higher prices, anticipating that they may get there anyway given the strength of the initial bull move - making this a buy vacuum test more so than a bull breakout leading to continued buying.
At this point, it would've been fine to draw in a bear trend line as shown in my annotations and copying that to form a channel line. This chart has a lot of trading range characteristics to it but we can also see how there's building selling pressure within it and using trend/channel lines can help highlight that.
The bear leg down to the channel line was the strongest move for the bears so far - 4 consecutive bear bars that are increasing in size and becoming more and more climactic. As the market is around the channel line, it is also around the lower third of the range of the day making it a reasonable place for shorts to cover and bulls to enter. The market responded to this location by forming a micro double bottom with two prominent tails below.
The next bar is the one that you pointed out - the bull inside bar above which a long trade was entered. I would've likely managed this a bit differently from what you had described. If I'd gotten long above that, I would've considered reversing to a short trade below that bull inside bar. If the long trade had been triggered above it and then subsequently reversed down below the bull inside bar, that would've been an outside bar and a L2 short with trapped longs, possibly leading to a measured move based on the strong 3rd leg down or to the low of the day. Do not underestimate the strength of the bears up to this point on the chart. Although the bull move in the beginning of the day was strong, the bears showed a lot of strength too. In this case, that potential short trade would not have been triggered and the market quickly pushed up to the bear trend line.
At the bear trend line, we see that there was a small bull doji that had an entry triggered above it (this would've been a relatively poor place to buy - consider the trader's equation again). That entry bar wound up turning into a bear outside bar and was a failed breakout attempt of the bear trend line. The bars that followed formed a lower high and a failed second attempt to break out. The bear doji that followed would've been a reasonable spot to exit on the close or 1 tick below if still holding long. We can see that many traders did sell and that formed a strong bear bar (give up bar). With two failed attempts to break out of the bear trend line and the prior bearishness that was seen, it would've been reasonable to get short even though the market is near the lower portion of the range given the overall context that we saw leading up to this point.
So the most important takeaway is to consider the story that's being told by the market to decide what to do, where to place stops, reasonable targets, who is trapped, when to close a trade based on current activity, where to potentially reverse, where to potentially enter long/short even if it is closer to the highs or lows, etc.

我没看错的话,应该没有超过下跌的50%,有时候要看很多因素,防止被骗K线


