The support forum is built with (1) General and FAQ forums for common trading queries received from aspiring and experienced traders, and (2) forums for course video topics. How to Trade Price Action and How to Trade Forex Price Action videos are consolidated into common forums.
Brooks Trading Course social media communities
Brooks Trading Course Learning Resources >>>

The daily bar on 18 December 2024 on gold futures (GC) shows a strong reversal up from 2598.1 and close at 2653.3 (see below).
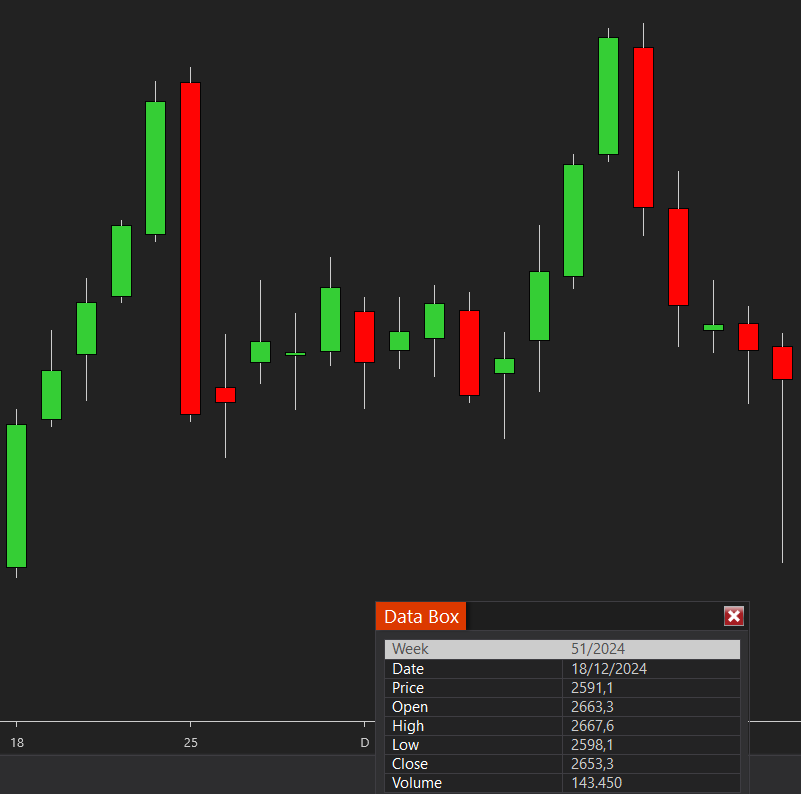
But if I go to the 5 minute chart, I cannot see the strong reversal up. We only reversed up from 2598.1 and closed at 2599.6
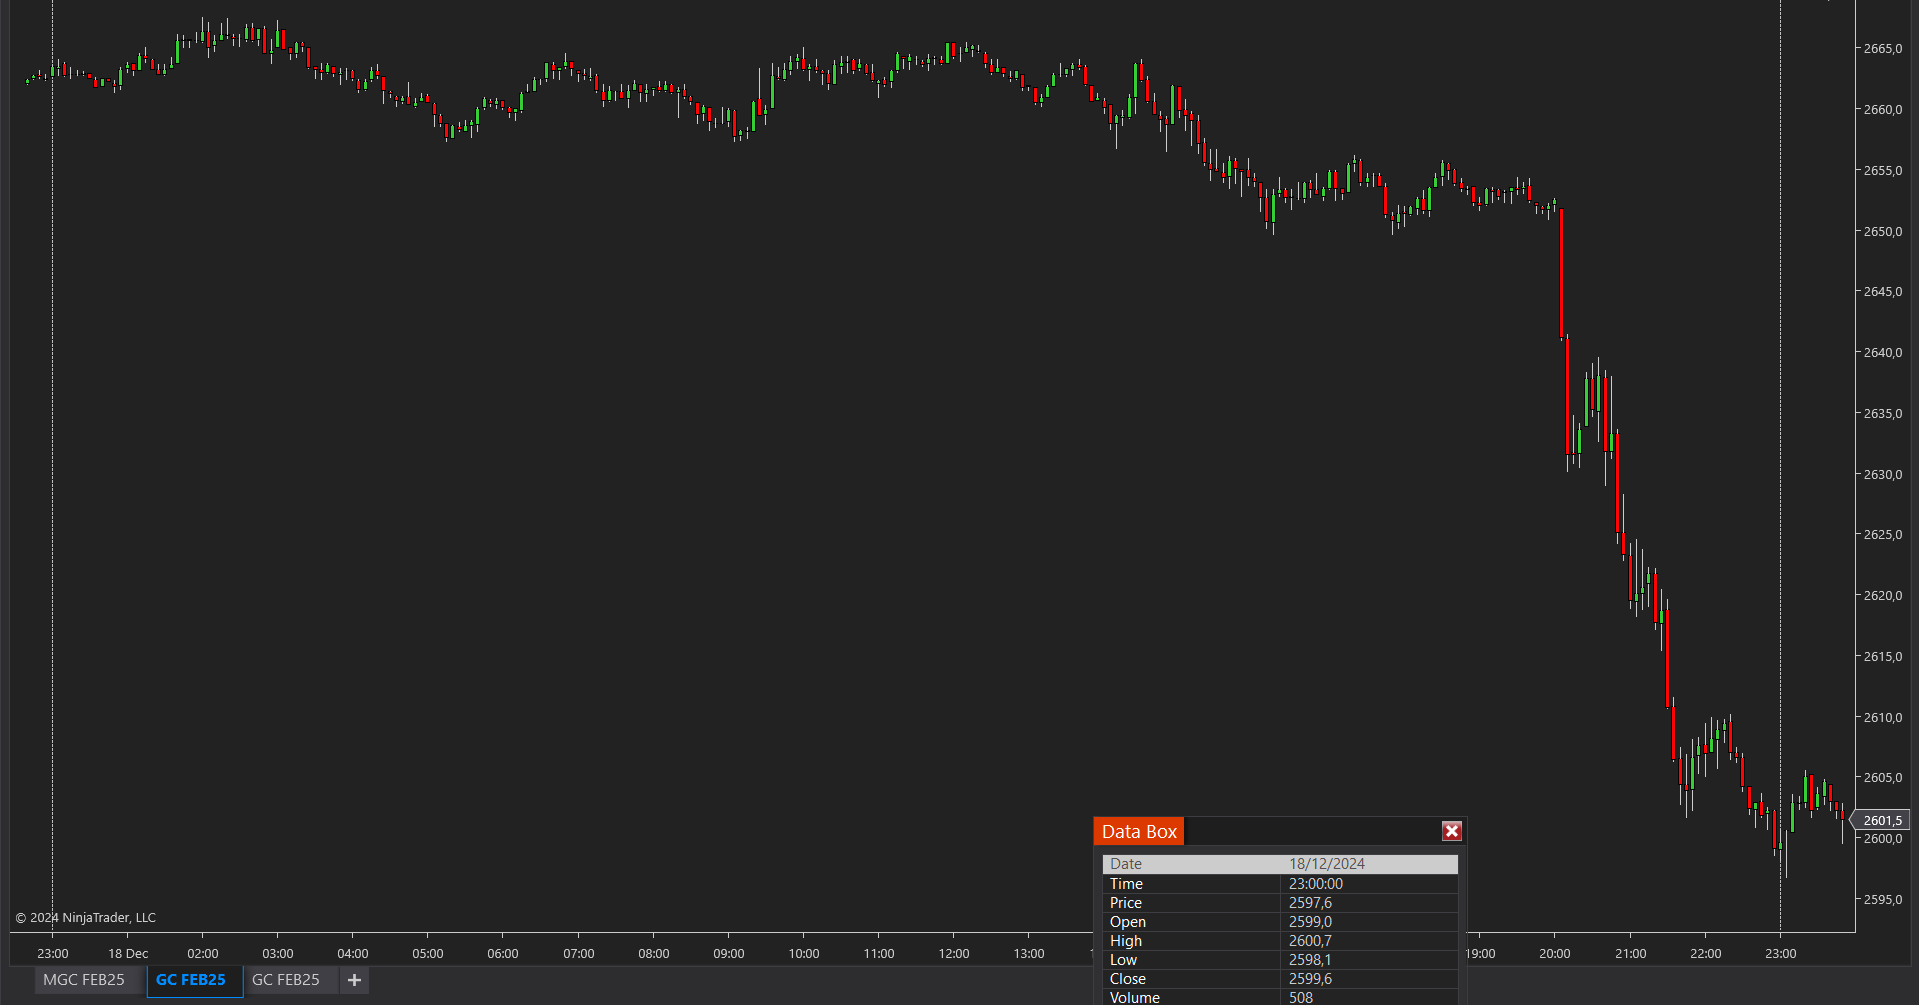
For gold futures trading hours, COMEX operates from 5:00 p.m. to 4:00 p.m. CT with a 60-minute break each day beginning at 4:00 p.m. CT.
Does someone know what caused this mismatch between daily close on the daily chart and 5 minute chart. This is not the first time it happens.

This is because your daily chart is set to show the settlement closing price, not the last price of the day. Settlement in gold takes place at 13:30:00 ET – see https://cmegroupclientsite.atlassian.net/wiki/spaces/EPICSANDBOX/pages/457088147/Gold#Normal-Daily-Settlement-Procedure
You can adjust this setting in your charting platform to have daily charts show the last price instead.
But isn't this weird then? The daily chart basically misrepresents the chart completely:
- We had a very strong selloff, but the daily chart shows as if we had a strong selloff and then had a big reversal up which clearly is not the case
I understand that I can create my own adjusted daily bar representing the intraday close values, but this doesn't give me a fulfilling answer to my question above though.
Why would CME choose a settlement time for the daily bar that is not aligning with the intraday closes, which in this case causes a huge misrepresentation due to the strong selloff by the FOMC meeting?
That's a remnant of the former pit sessions. Gold used to be traded in the pit from 8:20 AM to 1:30 PM ET.
Also CME wants to ensure that the settlement is calculated at a time that is liquid. The session is not as defined for gold anymore but if you look at crude oil or natural gas for example, the market is active until 2:30 PM ET (settlement, end of former pit session) and then volume collapses. Calculating settlement at 5 PM when the market is very thin would be considered a less reliable representation of the day's trading.
Indeed this can create a huge discrepancy between settlement and last price. Even in stock index futures where settlement is at 4:00 PM, the market can sometimes move significantly between 4 and 5 PM.

I understand the chart having a setting for close price based on settlement price vs last price, but if you choose settlement price, why would it show a low that occurred hours after the settlement time? Seems like a bug to me.

Not a bug, since the daily bar close is based upon predetermined terms, but these terms make the flow of information illogical for traders that use daily bars in their decision making to take trades or not.
So for example:
- A big bear breakout bar that closes on its low is a trend bar and has a higher probability of lower prices (i.e. if the daily bar was based on the intraday close)
- But a big bear bar that has a big bottom tail with close well above its midpoint is a failed breakout and a reversal bar, so this has a higher probability of sideways trading or even a reversal up (i.e. the daily bar that is based on the settlement close)
Again, I can of course decide to adjust my daily bar to intraday closes, but I don't want to do that because then it is not aligned with CME predetermined terms.
So basically I wanna know if there are any other traders that have experienced this problem before, and how they have tackled it. You just adjust the daily bar?

Again, I can of course decide to adjust my daily bar to intraday closes, but I don't want to do that because then it is not aligned with CME predetermined terms.
Settlement price is just a reference point 'for determining a position's daily profit or loss as well as the related margin requirements for the position': https://www.investopedia.com/terms/s/settlementprice.asp . That's why it's used as the default on many charting packages. But CME has no predetermined terms on what is the correct way to display the chart. Not everyone is a price action trader, maybe some institutions use line charts and only care about settlement prices each day.
So basically I wanna know if there are any other traders that have experienced this problem before, and how they have tackled it. You just adjust the daily bar?
I trade futures on the daily timeframe and never look at charts showing settlement prices, only last prices. In TradingView you can switch between settlement and last with one click: https://www.tradingview.com/support/solutions/43000685268-can-i-switch-settlement-and-last-prices-as-close-for-futures/
The only relevance of settlement prices for price action that I had noticed before is that sometimes they can act as support or resistance, but it's probably not significant enough to worry about if you trade daily charts.

It seems similar to RTH vs ETH question for ES futures, in which Al would say pick one and stick with it. But also ok and possibly good to consider both in your analysis.
However, if the low/high are not accurately represented then the chart isn't really valid. So yes the close isn't a bug, but if the low is not the low that occurred between the time of the open and the time of the close, that is a bug and an erroneous chart. So if that can't be fixed then I would just use the later close (akin to the ETH).
For ES futures people will say why use 81 bars instead of 78 bars for RTH since settlement time is now 3:00 CT, but the price action seems to care about the b81 close (and b81 H and L)... so point is whichever chart has better price action in your opinion is the one to use. This would take some time to study

It's impossible for the daily view to perfectly match the 5-minute view because they capture different things. The daily view might show reversals, while the 5-minute view could show gradual changes that eventually even out. This is because the 5-minute view captures short-term fluctuations that the daily view doesn't. 🫡


