Market Overview: Weekend Market Analysis The SP500 Emini futures monthly candlestick closed at all time high after an Emini outside-outside pattern (OO) and is in breakout mode. November likely to trade above October, and we could get a rare gap up on monthly, weekly and daily charts on Monday. The EURUSD Forex big bull bar […]
Emini pulling back into the end of October
Trading Update: Thursday October 28, 2021 Emini pre-open market analysis Emini daily chart Yesterday triggered a minor sell signal by trading below Tuesday’s low. Since it came in a strong bull trend, the reversal down should be only a few days days. Because yesterday closed on its low with the Emini pulling back, reversing down […]
Emini strong breakout attempt above September high
Trading Update: Tuesday October 26, 2021 Emini pre-open market analysis Emini daily chart Yesterday was a bull bar that broke to a new high. It is the 3rd consecutive bull bar closing above the September high (Friday’s close on the 5-minute chart was below the open, but it was above the open on the daily […]
October is 2nd consecutive outside bar on Emini monthly chart
Market Overview: Weekend Market Analysis The SP500 Emini futures market has an outside up bar in October after an outside down bar in September, the 2nd consecutive outside bar on the monthly chart. Traders should expect at least slightly higher prices in November. The EURUSD Forex market is reversing up from below its yearlong trading […]
Emini testing September all-time high

Trading Update: Thursday October 21, 2021 Emini pre-open market analysis Emini daily chart Yesterday rallied to within a few points of the September all-time high, but it closed in the middle of the day’s range. The 3-week rally has been strong enough to make a new high likely within a few days. It could come […]
Emini breaking above lower high of September 3
Trading Update: Tuesday October 19, 2021 Emini pre-open market analysis Emini daily chart Yesterday traded below Friday’s low and then above Friday’s high, making it an outside up day. It was the 4th consecutive bull day. Since it closed above Friday’s high, there is an increased chance of at least slightly higher prices today with […]
Emini breakout mode with double top and double bottom on daily chart
Al added some comments Market Overview: Weekend Market Analysis SP500 Emini Breakout Mode with both double top and double bottom flags on the daily chart. There is a 50% chance of a successful bull breakout and a 50% chance of a successful bear breakout. The EURUSD Forex is in a 2 week tight trading range. […]
Emini got back above 50-day MA yesterday, as expected
Trading Update: Friday October 15, 2021 Emini pre-open market analysis Emini daily chart There are 2 things that traders are watching most closely. The first is the 50-day moving average (MA). The Emini is now above 50-day MA. Next is the trading range that began with the September 20 low. I have been saying for […]
Emini in middle of September/October trading range
Trading Update: Wednesday October 13, 2021 Emini pre-open market analysis Emini daily chart Trading range since September 20 low. There is a lower low double bottom (September 20/October 4) and a lower high double top (September 23/October 7). In middle of September/October trading range. Breakout Mode, which means 50% chance of successful bull breakout and […]
Emini weak High 1 buy signal but in middle of 4-month trading range
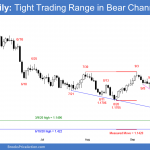
Trading Update: Monday October 11, 2021 Emini pre-open market analysis Emini daily chart Friday triggered a weak Low 2 sell signal. With Friday closing near its low, there is an increased chance of at least slightly lower prices today. Bears want gap down today or this week so that there would be an island top […]


