Although the adage “never add to a losing position” generally is good advice, most experienced traders also know that every rule has its exception. Many successful traders believe that they cannot pick an exact top or bottom reliably, but they are confident they know when one is forming. When that is the case, they often will choose to enter in stages, known as scaling into a position. Dollar-cost averaging is a widely used example of this practice. Traders can scale into shorts as they attempt to pick a top, or into longs when they expect a bottom. Here, we’ll examine this concept in the context of entering a bear trend.
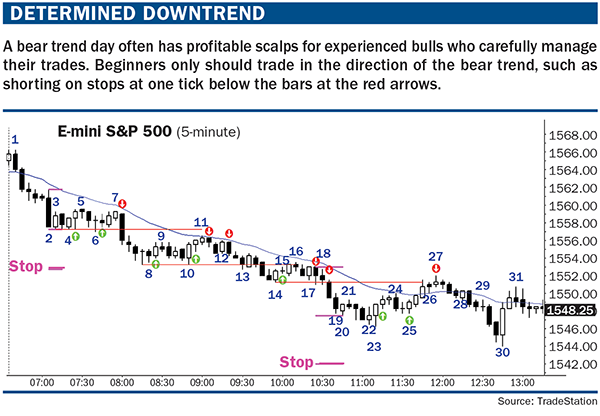
Scaling into reversals is not for beginners because it is betting against a trend. Usually when traders buy in a bear trend, they scalp for small profits. Such scalp trades are not necessarily advisable for beginners (see “Determined downtrend,” below). Beginning traders should wait for a major trend reversal to form. There should be a strong rally that breaks above the bear trendline, and then a weak resumption of the bear trend. At that point, a reversal up becomes a major trend reversal buy signal.

Probability forms the basis for scaling into a trade. When the market is in a strong breakout, the probability of the move sustaining profitability often is 60% or more. However, 90% of the time, the bulls and bears are evenly balanced, and the probability of a profitable trade is between 40% and 60%. The result is that great traders spend most of their lives comfortably living in a gray fog. Scaling into positions is one tool that can give them an edge.
Scale play
When a trader plans to scale into a long position in a falling market, it sometimes immediately reverses up after his first entry. Then he often will buy more as the market goes higher. This is scaling in at higher prices. A trader also can add to his position at a lower price if the market continues to fall after his initial entry.
Anyone who scales into a trade must have a plan to exit with either a profit or a loss, and trade management is a critical component to all profitable trading. When trading with or against a trend, a protective stop is important. You need to be aware of your maximum risk. If you are willing to lose up to $600 on a trade, structure every trade so the maximum loss is $600. This is per trade, not per contract. So, if you are willing to add to a trade two times as you scale in, the total loss on the entire position must be under the limit.
For example, if buying one E-mini S&P 500 contract, with a plan to scale in lower, and the initial stop is six points below this entry, the risk is $300. If the trader buys a second contract three points lower, he risks $150 on that second entry. Now total risk is $450. If one more contract is purchased when the market falls two additional points (five points below his first entry and two points below the second), $50 is risked on this contract, making total risk $500. This is acceptable because it is less than the maximum tolerable risk of $600.
Many signals can be used to add additional contracts. Some traders simply scale in at predetermined steps. Others will use price action signals. For example, a trader might plan to buy the second contract if any decent buy signal forms at least three points below the original entry. An obvious signal is another reversal up, but at a lower price. An aggressive trader even will buy the close of a big bear trend bar as long as the reversal premise still is intact. Because the trader expects the bear breakout to fail and the market to reverse up sharply, a strong bear close gives him an opportunity to buy at a better price with limited risk.
When a trader scales into longs during a bearish move, wide stops are necessary. If the E-mini has a recent daily range of 10 to 15 points, a reasonable risk might be four to six points from initial entry. This is a catastrophic stop that is designed to give the market room, but liquidate the position with a tolerable loss. You should never plan to let such a wide stop get hit, and almost always get out at a much better price. Once your premise is no longer valid, exit immediately.
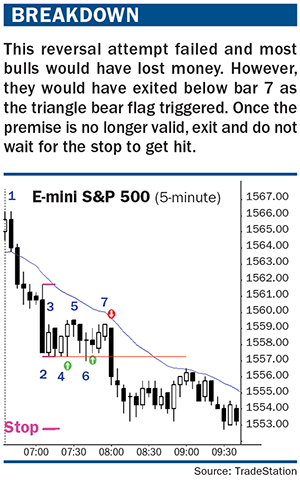
In “Breakdown” (right), the market had a bear breakout below the previous day’s low, but then formed an inside-inside (ii) pattern at bar 4. This means that bar 4 is an inside bar (its high and low do not extend beyond the range of the prior bar), and the prior bar also is an inside bar. An ii pattern is a common reversal one, and reversals are common on the open, especially after a breakout beyond the previous day’s range.

It is reasonable to buy on a stop above the high of bar 4 for a possible low of the day, and the buy order would have been filled on the next bar. Although many traders would place a protective stop below the low of bar 4, others would use a wider stop in case the market fell a bit below bar 4 and then reversed higher, as it did at bar 6.
In fact, many bulls would have placed limit orders to buy more at the bar 4 low, expecting a bear breakout to fail, which it did at bar 6. Some would even use a tiny stop of three or four ticks on that entry. The math is good for the trade because even if it only had a 40% chance of success, the reward would be many times greater, resulting in a positive Trader’s Equation. (The probability of success times the size of the profit target is significantly greater than the probability of loss times the size of the stop.)
Bulls would look to buy any sign of bear strength because they are expecting the market to rally enough to make a profitable scalp and the shorts to be losers. They might buy on a limit order at the bar 5 low or at the bear close on the bear bar that followed. There are institutions on both sides of every tick, so never assume that the market has to keep falling or rising. The probability only becomes lopsided during strong breakouts, and most of the time the market is well balanced, even when trending.
There are many ways to choose a stop. A trader simply could put one four, five or six points below the entry. Because measured moves are so important in trading, use one that is just beyond a measured move. For example, the most recent bear leg was a single bar, bar 2. Many bears would look to take partial or full profits at a measured move down below its low, based on the height of bar 2. Bulls might then put their stop a couple of ticks below that measured move. That would be a catastrophic stop, however. In all likelihood, their premise would be shown invalid before the stop, below bar 5, 6 or 7.
Many traders relying on a wide stop would not have exited as the market fell below bar 5, especially because it had a small body and lacked the conviction that the bear was about to resume. The reversal higher at bar 6 was a doji, and showed lack of conviction on the part of the bulls. The weak follow-through after the long and this weak second signal should combine to make bulls question their premise. Most bulls would exit below bar 7, or below bar 6, because they would not be willing to hold if the market turned against them a second time.
The market is still in a bear trend. Indeed, if the bear resumes a second time, this is a strong sell signal, even though bar 7 had a bull body. This is the reason why a low 2 short setup (a second sell signal) is so reliable in a bear trend. It is where most bulls give up. Those bulls usually will be unwilling to consider buying again for at least several bars, which means that the market is one-sided in favor of the bears.
Another factor that favored the bears is that bar 7 was the third push higher in a small trading range, making it a triangle. The first push up was the bull body of bar 3, and the second push up was the pair of bull bodies on bar 4 and the following bar. Any time the market has three pushes, it is in a triangle.
A similar situation developed at bar 8 and again at bar 14. The market might have been turning up from a failed breakout below the bar 7 triangle. Although there was no strong buy signal bar, if a trader bought above bar 8, he might have used a protective stop equal to the most recent bear leg (the bar 7 high to the low of the bar before bar 8). The bull might have bought more below bar 9 or above bar 10, or as 10 went above the prior bar.
However, most bulls would have exited below bar 11 or below the bear bar that followed. Remember, most bulls who are scalping in a bear trend will exit if the market fails after two attempts higher. It failed below bar 9 (a low 1 sell setup) and again below bar 11 (a low 2 sell setup, which is an A-B-C bear flag). The trader would not have waited for his catastrophic protective stop to be hit.
Bears would short below bar 11 or the bear bar that followed. Any short in a bear is a reasonable swing trade, and many have high enough probabilities for scalps as well. Scalps have to be high probability trades because the reward is usually not much bigger than the risk. You only can take a scalp if the probability is high, otherwise the math will cause you to lose money.
Turning tides
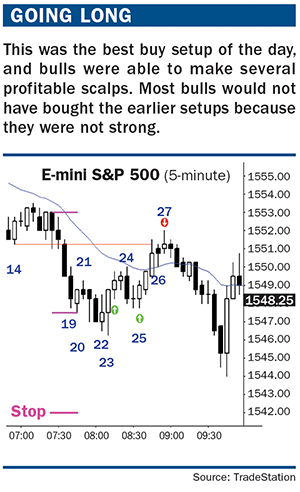
“Going long” (right) is an example of a strong buy scalp setup due to a combination of factors. The four bear bars down to bar 19 created the first breakout with four consecutive bear trend bars since the open. The final two were especially strong, with big bodies and closes near their lows. Whenever the strongest move occurs late in a trend, it is a climax and is usually followed by a correction. Bears will see the sudden flush as a great opportunity to take profits. They want to exit before the end of the day, and now they have a gift. Many will look to take full or partial profits soon.

Bar 20 is a bull reversal bar, but it is too small to reverse such a big breakout. Also, strong breakouts usually have a second push down before reversing. However, as the market moved above the bar 22 bull doji, and especially as it moved above the strong bar 23 bull reversal bars, most bears would take at least some off, and many bulls would buy. This is a second entry buy signal, and it is also a parabolic wedge, with the first two pushes down being the bar before bar 8 and then bar 14. Notice how the bar 11 high was a pullback from the breakout below bar 6, but it did not reach the bar 6 low. The bar 16 pullback went one tick above the bar 10 low, which means that the bulls were getting stronger. Each pullback tends to get stronger as more bears take profits and bulls buy more aggressively, so bulls expected the rally from the bar 23 low to go at least one tick above the bar 14 or bar 17 low. This gave them the potential to make two to three points of profit, depending on where they bought.
The bulls buy because they know that this is a strong sell climax late in a bear, and that the bears will not look to sell aggressively again until the market goes up for several points. My general guideline is TBTL: Ten Bars and Two Legs. If the bears were planning on shorting again one or two bars later or one point higher, they would not have exited. Because this was such an unexpectedly big gift, they are compelled to exit at least part of their position, making the odds favor a bounce. If bulls bought above bar 20, which is early, they might have used a stop based on the height of the most recent bear leg, which is the four-bar breakout from the bar 18 high (or open) to the bar 20 low (or the bar 19 close).
Bulls then would put their protective stop just below that measured move target and buy additional contracts consistent with their plan. They simply could buy above bar 20, use the wide stop and not scale in. They also could scale in one or two points lower, at the bar 21 low, as the market fell below bar 20, at the close of the bear bar before bar 22, at the bull close of bar 22, below bar 22, above bars 22 or 23, below bar 24, above bar 25 or as bar 25 moved above the prior bar. They could have planned to scale in three or four points lower, and then one more time just a point above their stop. These orders obviously would not have been filled. In any case, they represent a viable plan that keeps total risk in mind.
As for profits, we are expecting TBTL. We get that at bar 27. Some would scalp out with one, two or three points, depending on actual risk. Others would exit as the market moved above the bar 14 low, or as it fell below bar 27 because that is a sell signal. It is the first “moving average gap bar” (a bar with a low above the moving average where the next bar fell below its low) in a bear trend. Therefore, it is likely to lead to the final leg of the bear before a major reversal, which took place into the close and during the next day. It is also a wedge bear flag where the first two pushes up occurred at the highs of bars 21 and 24. And, it was a breakout above the bear channel from the high of the day (not shown), and most breakout attempts against the trend fail.
This is based on an article from the July/August 2013 issue issue of Futures magazine.