Market Overview: S&P 500 Emini Futures The market formed a weekly Emini big bull bar closing near its high. The bulls need to create follow-through buying following this week’s strong breakout to increase the odds of testing the trend channel line. The bears see this week’s big bull bar as part of a developing buy […]
Nifty 50 2nd Leg Down
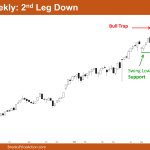
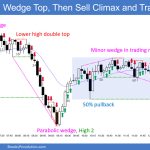
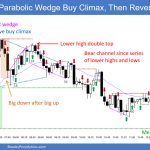
Market Overview: Nifty 50 Futures Nifty 50 2nd Leg Down on the weekly chart. This week, the market closed weakly with long tails on both ends, and it’s currently trading in a narrow bear channel near a swing low that is acting as support. The market has now started a second leg down after a […]
Nasdaq 100 Bull Breakout to New All-Time High Close
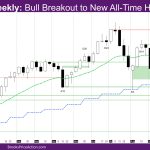
Market Overview: NASDAQ 100 Emini Futures The NASDAQ Emini futures week is a surprise bull breakout to new all-time high close, just above the prior all-time high. On the daily chart, the market had a big bull breakout of the exponential moving average (EMA) on Wednesday with good follow-through on Thursday after the election results. […]
Emini Profit Taking at 6,000 Round Number
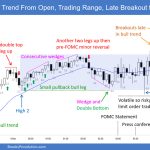
Trading Update: Friday November 8, 2024 S&P Emini market analysis Emini daily chart Emini 5-minute chart and what to expect today Yesterday’s Emini setups Richard created the SP500 Emini chart – Al travelling. Here are reasonable stop entry setups from yesterday. I show each buy entry bar with a green arrow and each sell entry […]
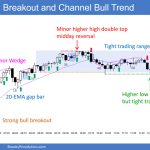
Emini Unable to Escape 6,000 Round Number
Trading Update: Thursday November 7, 2024 Emini end of day video review Follow Rose’s YouTube channel for more Al Brooks price action analysis. S&P Emini market analysis Emini daily chart Emini 5-minute chart and what to expect today Yesterday’s Emini setups Al created the SP500 Emini chart. Here are reasonable stop entry setups from yesterday. […]
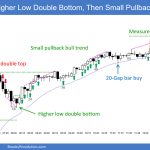
Emini Bulls Want Reversal Up to 6,000
Trading Update: Wednesday November 6, 2024 Emini end of day video review S&P Emini market analysis Emini daily chart Emini 5-minute chart and what to expect today Yesterday’s Emini setups Al created the SP500 Emini charts. Here are reasonable stop entry setups from yesterday. I show each buy entry bar with a green arrow and […]
Al Brooks Trading Room Session Recap
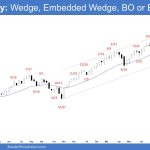
Open house session (November 1) recap by Louie Wong Visit Louie’s YouTube channel for more price action analysis (Chinese) Transcript We all know that if you have a pair of trend bars with at least one of them being big enough, there is a higher probability to see the trend from the open. Which is […]
Emini Election Day for United States
Trading Update: Tuesday November 5, 2024 Emini end of day video review Follow Joseph’s YouTube channel for more Al Brooks price action analysis. S&P Emini market analysis Emini daily chart Emini 5-minute chart and what to expect today Yesterday’s Emini setups Al created the SP500 Emini charts. Here are reasonable stop entry setups from yesterday. […]
Emini Weak Inside Bar
Trading Update: Monday November 4, 2024 Emini end of day video review Follow Joseph’s YouTube channel for more Al Brooks price action analysis. S&P Emini market analysis Emini daily chart Emini 5-minute chart and what to expect today Friday’s Emini setups Al created the SP500 Emini charts. Here are reasonable stop entry setups from Friday. […]
Bitcoin October bar traded near all-time high
Market Overview: Bitcoin This week, the October monthly bar closed with a bull bar that nearly reached Bitcoin’s previous all-time high. The monthly close, positioned above September’s high, suggests that November or December may bring a renewed attempt to test October’s high. Reflecting on the year so far, Bitcoin has largely moved within a trading […]

