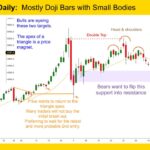
Gold GC-Mini Market Analysis The weekly Gold GC-mini chart is in a trading range following a climax. While the trend is up, the price action is becoming increasingly two-sided. This week there was bullish follow through. Printing 3 consecutive bull bars puts the market into always in long. Take note of the bull bars gradually […]
E-mini Follow-through for Bulls

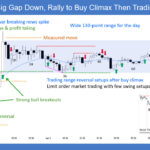
Trading Update: Friday April 10, 2026 E-mini end of day video review S&P E-mini market analysis E-mini daily chart E-mini 5-minute chart and what to expect today Yesterday’s E-mini setups Richard created the SP500 E-mini chart. Here are reasonable stop entry setups from yesterday. Chart shows each buy entry bar with a green arrow and […]
E-mini Bulls Want Test of All-Time High
Trading Update: Thursday April 9, 2026 E-mini end of day video review S&P E-mini market analysis E-mini daily chart E-mini 5-minute chart and what to expect today Yesterday’s E-mini setups Richard created the SP500 E-mini chart. Here are reasonable stop entry setups from yesterday. Chart shows each buy entry bar with a green arrow and […]
E-mini Bulls Getting Breakout Above Daily Moving Average
Trading Update: Wednesday April 8, 2026 E-mini end of day video review S&P E-mini market analysis E-mini daily chart E-mini 5-minute chart and what to expect today Yesterday’s E-mini setups Richard created the SP500 E-mini chart. Here are reasonable stop entry setups from yesterday. Chart shows each buy entry bar with a green arrow and […]
E-mini 6,650 Round Number Acting as Resistance
Trading Update: Tuesday April 7, 2026 S&P E-mini market analysis E-mini daily chart E-mini 5-minute chart and what to expect today Yesterday’s E-mini setups Richard created the SP500 E-mini chart. Here are reasonable stop entry setups from yesterday. Chart shows each buy entry bar with a green arrow and each sell entry bar with a […]
E-mini Sideways at Daily Moving Average
Trading Update: Monday April 6, 2026 E-mini end of day video review S&P E-mini market analysis E-mini daily chart E-mini 5-minute chart and what to expect today Last Thursday’s E-mini setups Richard created the SP500 E-mini chart. Here are reasonable stop entry setups from last Thursday, before Good Friday holiday break. Chart shows each buy […]
Nifty 50 Bull Channel
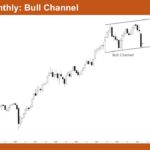
Market Overview: Nifty 50 Futures Nifty 50 Bull Channel on the monthly chart. The market has been trading in a well-defined bull channel for several years, with consistent higher highs and higher lows. Recently, the market has been consolidating near the channel top with overlapping price action, which suggests the bulls are losing momentum and […]
Bitcoin Weekly 2nd Leg Down in Major Trading Range

Summary Bitcoin is transitioning from a bear channel into a long-term trading range due to the inertia of the preceding bull trend. The core thesis is that after a “second leg down,” the market is likely to seek equilibrium in the middle third of its range (the $80,000–$100,000 zone) Duration 9:48 mins. AI is voicing […]
EURUSD Testing the 20-Month EMA
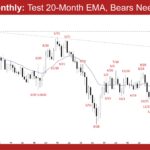
Market Overview: EURUSD Forex The market is in a pullback phase, with EURUSD testing the 20-month EMA. Bulls want the 20-month EMA and the August 1 low to act as support, followed by a retest of the prior trend extreme high (January 27). Bears need consecutive strong bear bars breaking below the 20-month EMA and […]
Crude Oil Retest of Prior High
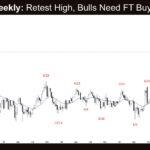
Market Overview: Crude Oil Futures The market is in a Crude Oil retest of prior high. Bulls want a retest and breakout above the March 9 high, with sustained follow-through buying. If the market trades higher, bears want a failed breakout above the March 9 high, with prominent upper tails or bear bars. Crude oil […]

