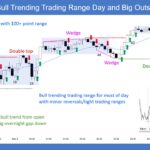
Trading Update: Friday March 6, 2026 E-mini end of day video reviews S&P E-mini market analysis E-mini daily chart Yesterday’s E-mini setups Richard created the SP500 E-mini chart. Here are reasonable stop entry setups from yesterday. Chart shows each buy entry bar with a green arrow and each sell entry bar with a red arrow. […]
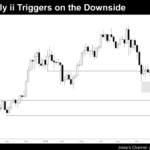
E-mini Bulls Hopeful Buyers below Yesterday’s Low
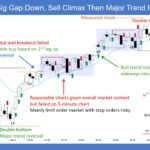
Trading Update: Thursday March 5, 2026 E-mini end of day video review S&P E-mini market analysis E-mini daily chart E-mini 5-minute chart and what to expect today Yesterday’s E-mini setups Richard created the SP500 E-mini chart. Here are reasonable stop entry setups from yesterday. Chart shows each buy entry bar with a green arrow and […]
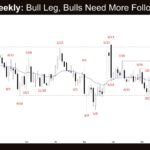
E-mini Bulls Want 2nd Leg and Test of All-Time High
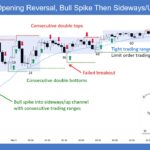
Trading Update: Wednesday March 4, 2026 E-mini end of day video review S&P E-mini market analysis E-mini daily chart E-mini 5-minute chart and what to expect today Yesterday’s E-mini setups Richard created the SP500 E-mini chart. Here are reasonable stop entry setups from yesterday. Chart shows each buy entry bar with a green arrow and […]
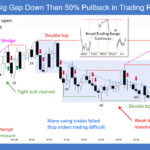
E-mini Bears Getting Downside Breakout of Tight Trading Range
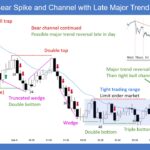
Trading Update: Tuesday March 3, 2026 E-mini end of day video review S&P E-mini market analysis E-mini daily chart E-mini 5-minute chart and what to expect today Yesterday’s E-mini setups Richard created the SP500 E-mini chart. Here are reasonable stop entry setups from yesterday. Chart shows each buy entry bar with a green arrow and […]
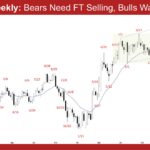
E-mini Bulls Want Upside Breakout
Trading Update: Monday March 2, 2026 E-mini end of day video review S&P E-mini market analysis E-mini daily chart E-mini 5-minute chart and what to expect today Yesterday’s E-mini setups Richard created the SP500 E-mini chart. Here are reasonable stop entry setups from yesterday. Chart shows each buy entry bar with a green arrow and […]
Bitcoin Monthly Bear Breakout and Always In Short Testing $50,000
Market Video Report: Bitcoin Duration 9:50 mins. Summary This analysis explores Bitcoin’s current market cycle across monthly, weekly, and daily timeframes. While February’s bear breakout suggests an “Always In Short” status, the broader context points toward a major trading range rather than a new bear trend. Key levels include the $50,000 reversal zone and a […]
Monthly EURUSD IOI Pattern
Market Overview: EURUSD Forex The market formed a monthly EURUSD ioi pattern. Bulls want an upside breakout; bears want a downside breakout with sustained follow-through. Traders will watch which direction the market breaks out and whether follow-through develops. EURUSD Forex market The Monthly EURUSD Forex chart The Weekly EURUSD chart Market analysis reports archive You […]
Monthly Crude Oil Follow-through Bull Bar
Market Overview: Crude Oil Futures The market formed a monthly Crude oil follow-through bull bar above the 20-month EMA. Bulls need more follow-through buying breaking strongly above the July high and the bear trend line to increase the odds of a strong bull leg. Bears want the July high or the bear trend line to […]
Monthly E-mini Tight Trading Range
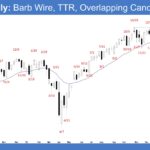
Market Overview: S&P 500 E-mini Futures The market formed a monthly E-mini tight trading range near the all-time high. Four consecutive dojis signal temporary balance between bulls and bears. Traders will watch for a breakout in either direction and, more importantly, the strength of follow-through. S&P500 E-mini futures The Monthly E-mini chart The Weekly S&P […]
Nifty 50 Month End Doji Close
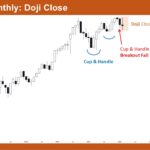
Market Overview: Nifty 50 Futures Nifty 50 Doji Close and Failed Cup and Handle Breakout on the monthly chart. The market this month formed a doji bar after a failed breakout attempt from the second cup and handle pattern, suggesting that bulls are taking profits near the all-time highs around 26,000. The failed breakout may […]

