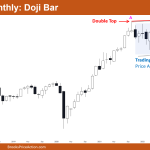
Market Overview: Nifty 50 Futures Nifty 50 doji bar on monthly chart. After three consecutive bear bars, the market created a doji bar this month. The monthly chart is in a bull trend, the market may be trading in a bull channel. The price action over the past 20 bars on the monthly chart shows […]
Emini Final Day of Month
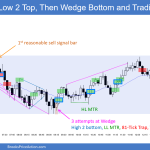
Trading Update: Friday March 31, 2023 S&P Emini pre-open market analysis Emini daily chart Emini 5-minute chart and what to expect today Yesterday’s Emini setups Al created the SP500 Emini charts. Here are several reasonable stop entry setups from yesterday. I show each buy entry with a green rectangle and each sell entry with a […]
Emini Bulls Chance for Strong Breakout above March 22nd
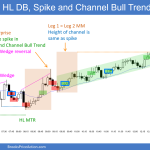
Trading Update: Thursday March 30, 2023 S&P Emini pre-open market analysis Emini daily chart Emini 5-minute chart and what to expect today Emini intraday market update Yesterday’s Emini setups Al created the SP500 Emini charts. Here are several reasonable stop entry setups from yesterday. I show each buy entry with a green rectangle and each […]
Emini Bulls Trying for 2nd Leg Up
Trading Update: Wednesday March 29, 2023 S&P Emini pre-open market analysis Emini daily chart Emini 5-minute chart and what to expect today Emini intraday market update (I will try and update through-out the day). Yesterday’s Emini setups Al created the SP500 Emini charts. Here are several reasonable stop entry setups from yesterday. I show each […]
Emini Sideways Around Big Round Number 4,000
Trading Update: Tuesday March 28, 2023 S&P Emini pre-open market analysis Emini daily chart Emini 5-minute chart and what to expect today Yesterday’s Emini setups Al created the SP500 Emini charts. Here are several reasonable stop entry setups from yesterday. I show each buy entry with a green rectangle and each sell entry with a […]
Emini Likely to Disappoint Bull and Bears
Trading Update: Monday March 27, 2023 S&P Emini pre-open market analysis Emini daily chart Emini 5-minute chart and what to expect today Emini intraday market update Yesterday’s Emini setups Al created the SP500 Emini charts. Here are several reasonable stop entry setups from yesterday. I show each buy entry with a green rectangle and each […]
Bitcoin at June 2021 Low
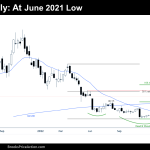
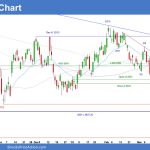
Market Overview: Bitcoin Futures Bitcoin at June 2021 low. This week, the price increased by +2.86% of its value. There were trapped bulls at the June 2021 low who finally got their opportunity to exit their trade. A bear leg should follow. Bitcoin futures The Weekly chart of Bitcoin futures Analysis Trading The Daily chart of […]
EURUSD Weak Breakout from OO
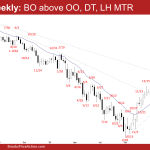
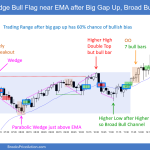
Market Overview: EURUSD Forex The EURUSD Forex weekly candlestick was a EURUSD weak breakout from an OO (outside-outside) pattern. The bulls will need to create follow-through buying to increase the odds of a retest of the February high. The bears want a failed breakout above the OO pattern and a breakout below instead. They want a reversal […]
Crude Oil Failed Bear Breakout
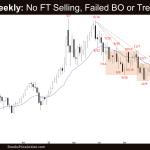
Market Overview: Crude Oil Futures The Crude oil futures traded slightly lower but had no follow-through selling on the weekly chart, a Crude Oil failed bear breakout. The bears hope that the move is simply a breakout test of the 16-week trading range low (breakout point) and wants at least a small second leg sideways […]
Emini Weak Bull Follow-through
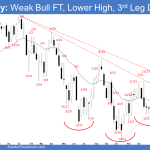
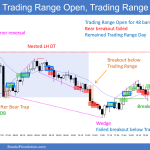
Market Overview: S&P 500 Emini Futures The S&P 500 Emini futures weekly candlestick was a weak bull follow-through bar. The Emini is in a smaller 22-week trading range around 3750 and 4200. The market is currently trading around the middle of this range. Poor follow-through and reversals are hallmarks of a trading range. Traders will […]

