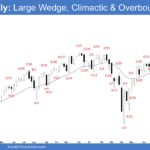
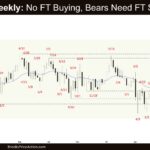
Market Overview: S&P 500 E-mini Futures The S&P 500 E-mini bears need follow-through selling on the weekly chart, something they couldn’t do since the April low. If the market trades lower, the bulls want the 20-week EMA or the September 2 low area to act as support. S&P500 E-mini futures The Weekly S&P 500 E-mini […]
Nifty 50 Strong Bull Close
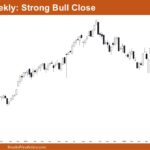
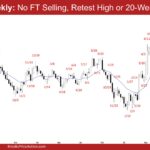
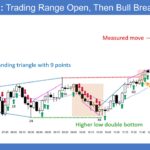
Market Overview: Nifty 50 Futures Nifty 50 Strong Bull Close on the weekly chart. This week, the market closed strongly on a bullish note near the upper trend line of the triangle pattern. The market is not yet in breakout mode, and the chances of a successful breakout are roughly 50-50 in either direction. Since […]
Nasdaq 100 Big Bear Reversal Bar at Monthly Measured Move Bull Target
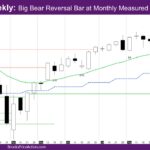
Market Overview: NASDAQ 100 Emini Futures The NASDAQ Emini futures week is a big bear reversal bar at monthly measured move bull target mentioned in prior reports. The daily chart is alternating bull/bear bars for the week, except Friday, which is a big bear bar closing far below the daily exponential moving average (EMA). The […]
6-Bar E-mini Bull Microchannel
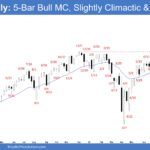
The market formed a 6-bar E-mini bull microchannel on the monthly chart. The next targets for the bulls are the 6900 and 7000 levels. If there is a pullback, they hope to get at least a small second leg sideways to up to retest the trend extreme high (now Oct 3). The bears want a […]
Monthly Crude Oil Trading Around the Middle of Trading Range
The monthly Crude Oil trading around the middle of trading range (20-month EMA) for the last few months. The bears need to create follow-through selling below the 20-month EMA to increase the odds of testing the trading range low. The bulls view the current move as a pullback and want it to form a higher […]
Monthly EURUSD Wedge Pattern
The market formed a monthly EURUSD wedge pattern (Apr 21, Jul 1, and Sept 17). The bears want the bear trend line and the upper third of the multi-year trading range to be areas of resistance. The bulls want a retest of the September 17 high, even if it only forms a lower high. If […]
Nifty 50 Weak Bull Close
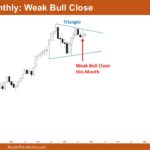
Market Overview: Nifty 50 Futures Nifty 50 Weak Bull Close on the monthly chart. After an initial rise, the market experienced a sharp fall in the last week of the month, resulting in a weak bullish close. The market is also forming a triangle pattern. On the weekly chart, Nifty 50 is currently trading at […]
Nasdaq 100 MM Bull Target of 2021 High Close and 2022 Low Close Met
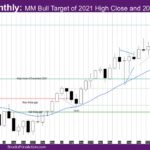
Market Overview: NASDAQ 100 Emini Futures The NASDAQ Emini futures September 2025 monthly bar is a bull bar with small tails, and the first measured move – MM bull target of 2021 high close and 2022 low close met. The week is a bull bar with a prominent tail above. The quarter bar is a […]
S&P500 E-mini market analysis reports
Due to the Brooks Trading Course team being at the Orlando Live Trading Workshop, there will be no daily reports or charts issued until next Monday, October 13,2025 Thanks for your understanding. Summary of today’s S&P E-mini price action Al created the SP500 E-mini chart. Here are reasonable stop entry setups from yesterday. I show […]
Emini Testing Last Week’s All-Time High
Trading Update: Wednesday October 1, 2025 S&P E-mini market analysis E-mini daily chart E-mini 5-minute chart and what to expect today Yesterday’s E-mini setups Al created the SP500 E-mini charts. Here are reasonable stop entry setups from yesterday. I show each buy entry bar with a green arrow and each sell entry bar with a […]

