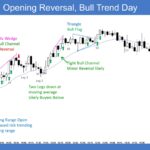
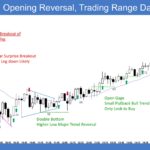
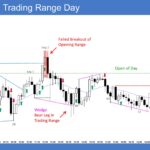
Trading Update: Monday July 14, 2025 S&P E-mini market analysis E-mini daily chart E-mini 5-minute chart and what to expect today Friday’s E-mini setups Brad created the SP500 E-mini charts – Al travelling. Here are reasonable stop entry setups from last Friday. I show each buy entry bar with a green arrow and each sell […]
Bitcoin Bull Breakout of Cup and Handle
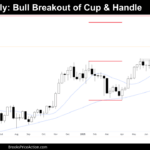
Market Overview: Bitcoin Bitcoin The Weekly chart of Bitcoin The Daily chart of Bitcoin Market analysis reports archive You can access all weekend reports on the Market Analysis page.
EURUSD Pullback Below the Bull Microchannel
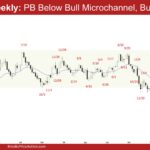
Market Overview: EURUSD Forex The market formed a EURUSD pullback below the bull microchannel this week. The bulls want a retest of the recent leg extreme high (Jul 1) followed by a continuation of the move. The bears must create follow-through selling to increase the odds of a deeper pullback. EURUSD Forex market The Weekly […]
Weekly Crude Oil Bear Flag
Market Overview: Crude Oil Futures The market is forming a weekly Crude Oil bear flag on the weekly chart. The bulls must create more bull bars to increase the odds of retesting the June 23 high. The bears see the last two weeks as a pullback and want another strong leg down from a lower […]
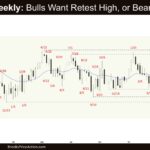
Weekly Emini Tight Bull Channel
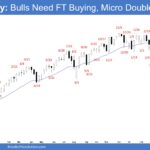
Market Overview: S&P 500 Emini Futures The market formed a weekly Emini tight bull channel testing the prior all-time high. The bulls must create a strong breakout above the prior all-time high (Dec 6) with follow-through buying to increase the odds of a sustained move. The bears want a failed breakout above the prior all-time […]
Nifty 50 Tight Trading Range Breakout Fail
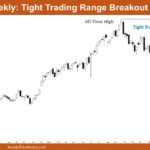
Market Overview: Nifty 50 Futures Nifty 50 Tight Trading Range Breakout Fail on the weekly chart. The market closed strongly bearish this week, marking the second consecutive bearish close following a strong bullish breakout from the tight trading range. It continues to trade within the bull channel and is currently nearing the lower boundary of […]
Nasdaq 100 Small Bear Doji After 06-23 Bull Breakout
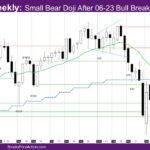
Market Overview: NASDAQ 100 Emini Futures The NASDAQ Emini futures week is a small bear doji after 06-23 bull breakout. It is a bad sell signal bar. The daily chart is sideways – a doji bear Monday, followed by a couple of days of up, followed by a couple of days of bear dojis. Since […]
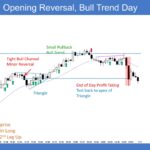
Emini Profit Taking above July 3rd High
Trading Update: Friday July 11, 2025 Emini end of day video review Follow Joseph’s YouTube channel for more Al Brooks price action analysis. S&P Emini market analysis Emini daily chart Emini 5-minute chart and what to expect today Yesterday’s Emini setups Brad created the SP500 Emini charts – Al travelling. Here are reasonable stop entry […]
Emini Follow-Through Buying above High 1 Buy Signal
Trading Update: Thursday July 10, 2025 Emini end of day video review S&P Emini market analysis Emini daily chart Emini 5-minute chart and what to expect today Yesterday’s Emini setups Brad created the SP500 Emini charts – Al travelling. Here are reasonable stop entry setups from yesterday. I show each buy entry bar with a […]
Emini Weak High 1 Buy Signal Bar
Trading Update: Wednesday July 9, 2025 Emini end of day video review Follow Joseph’s YouTube channel for more Al Brooks price action analysis. S&P Emini market analysis Emini daily chart Emini 5-minute chart and what to expect today Yesterday’s Emini setups Brad created the SP500 Emini charts – Al travelling. Here are reasonable stop entry […]

