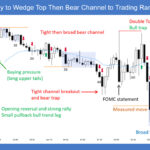
Trading Update: Tuesday June 24, 2025 Emini end of day video review S&P Emini market analysis Emini daily chart Emini 5-minute chart and what to expect today Yesterday’s Emini setups Brad created the SP500 Emini chart – Al travelling. Here are reasonable stop entry setups from yesterday. I show each buy entry bar with a […]
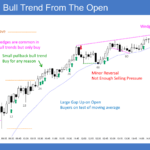
Emini Bulls Want Resumption Above June 11th High
Trading Update: Monday June 23, 2025 Emini end of day video review Follow Joseph’s YouTube channel for more Al Brooks price action analysis. S&P Emini market analysis Emini daily chart Emini 5-minute chart and what to expect today Yesterday’s Emini setups Al created the SP500 Emini chart. Here are reasonable stop entry setups from yesterday. […]
Bitcoin Weak Low 2 after Strong Bull Leg
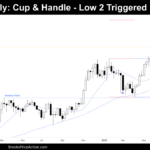
Market Overview: Bitcoin Bitcoin triggered a Low 2 setup on the weekly chart. The Low 2 setup is also the Handle of a Cup and Handle Pattern. Bitcoin The Weekly chart of Bitcoin The Daily chart of Bitcoin Market analysis reports archive You can access all weekend reports on the Market Analysis page.
EURUSD Bulls Need a Strong Breakout
Market Overview: EURUSD Forex The EURUSD bulls need a strong breakout with sustained follow-through buying above the April 21 high. The bears want a reversal from a higher high major trend reversal and a wedge pattern (Mar 18, Apr 21, and Jun 12). EURUSD Forex market The Weekly EURUSD chart The Daily EURUSD chart Market […]
Crude Oil Bull Leg Within the Trading Range
Market Overview: Crude Oil Futures The market formed a Crude Oil bull leg within the trading range. The bulls hope to get a breakout above the top of the trading range and a measured move based on the height of the trading range. The bears want the upper third of the trading range to act […]
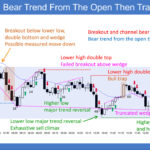
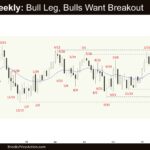
The Emini Bears Need Strong Follow-through Selling
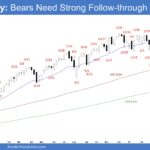
Market Overview: S&P 500 Emini Futures The Emini bears need strong follow-through selling trading below the 20-week EMA to increase the odds of a deeper pullback. The bulls want any pullback to be weak and sideways and want the 20-week EMA to act as support. S&P500 Emini futures The Weekly S&P 500 Emini chart The […]
Nifty 50 Tight Trading Range
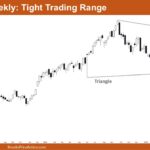
Market Overview: Nifty 50 Futures Nifty 50 Tight Trading Range on the weekly chart. The market closed strongly bullish this week with almost no tail at the top. As the market remains within a tight trading range, it becomes difficult for both bulls and bears to make profits. If the bears manage to start a […]
Nasdaq 100 Continuation of Sideways Move
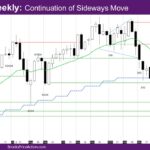
Market Overview: NASDAQ 100 Emini Futures The NASDAQ Emini futures week is a doji bull bar with a longer tail above, signifying the continuation of sideways move. The daily chart started with a big bull bar on Monday, then sideways to down for the rest of the week to the daily exponential moving average (EMA). […]
Emini Sideways at Daily Moving Average
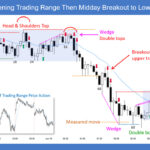
Trading Update: Friday June 20, 2025 S&P Emini market analysis Emini daily chart Emini 5-minute chart and what to expect today Wednesday’s Emini setups Richard created the SP500 Emini chart – Al travelling. Here are reasonable stop entry setups from Wednesday (before US holiday). I show each buy entry bar with a green arrow and […]
Emini Needs Test of Moving Average
Trading Update: Wednesday June 18, 2025 S&P Emini market analysis Emini daily chart Emini 5-minute chart and what to expect today Yesterday’s Emini setups Richard created the SP500 Emini chart – Al travelling. Here are reasonable stop entry setups from yesterday. I show each buy entry bar with a green arrow and each sell entry […]

