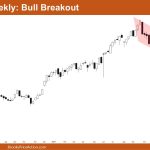
Market Overview: Nifty 50 Futures Nifty 50 Bull Breakout on the weekly chart. This week, the market closed with a doji candlestick, featuring a long upper tail. For a successful bull breakout, the bulls need strong follow-through. On the daily chart, the Nifty 50 nearly reached the measured move of the measuring gap, but the […]
Emini Weak High 1 Buy Signal Bar
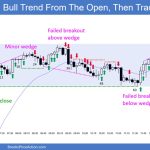
Trading Update: Friday March 28, 2025 Emini end of day video review S&P Emini market analysis Emini daily chart Emini 5-minute chart and what to expect today Yesterday’s Emini setups Al created the SP500 Emini charts. Here are reasonable stop entry setups from yesterday. I show each buy entry bar with a green arrow and […]
Emini Bad Follow-Through after Yesterday’s Selloff
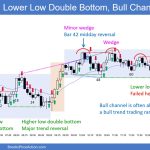
Trading Update: Thursday March 27, 2025 S&P Emini market analysis Emini daily chart Emini 5-minute chart and what to expect today Yesterday’s Emini setups Al created the SP500 Emini charts. Here are reasonable stop entry setups from yesterday. I show each buy entry bar with a green arrow and each sell entry bar with a […]
Emini Bulls Getting Close above Daily Moving Average
Trading Update: Wednesday March 26, 2025 Emini end of day video review Follow Rose’s YouTube channel for more Al Brooks price action analysis. S&P Emini market analysis Emini daily chart Emini 5-minute chart and what to expect today Yesterday’s Emini setups Al created the SP500 Emini charts. Here are reasonable stop entry setups from yesterday. […]
Emini Likely to Stall at Daily Moving Average
Trading Update: Tuesday March 25, 2025 Emini end of day video review Follow Joseph’s YouTube channel for more Al Brooks price action analysis. S&P Emini market analysis Emini daily chart Emini 5-minute chart and what to expect today Yesterday’s Emini setups Al created the SP500 Emini charts. Here are reasonable stop entry setups from yesterday. […]
Emini Testing Daily Moving Average
Trading Update: Monday March 24, 2025 Emini end of day video review See Price Action Rose’s YouTube channel for another End of day review. S&P Emini market analysis Emini daily chart Emini 5-minute chart and what to expect today Friday’s Emini setups Al created the SP500 Emini charts. Here are reasonable stop entry setups from […]
Bitcoin approaching Q1 2025 ends

Market Overview: Bitcoin As the final week of March 2025 unfolds, Bitcoin languishes in a subdued cadence, a stark contrast to the volatility that defined its earlier chapters this year. With the month’s end coinciding with the close of Q1, next week offers a juncture to reflect on 2025’s nascent trajectory. For this analysis, I […]
Weekly EURUSD Micro Wedge
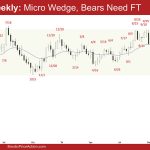
Market Overview: EURUSD Forex The market formed a weekly EURUSD micro wedge around the November 6 high. The bears must create strong follow-through selling to increase the odds of a deep pullback. The bulls want any pullback weak and sideways (overlapping candlesticks, doji(s), bull bars). EURUSD Forex market The Weekly EURUSD chart The Daily EURUSD […]
Crude Oil Bulls Need Follow-through Buying
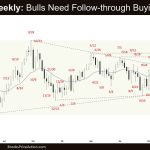
Market Overview: Crude Oil Futures The Crude Oil bulls need follow-through buying trading back above the 20-week EMA. They want the bull leg within the trading range to begin. The bears want the bear trend line or the 20-week EMA to act as resistance. Crude oil futures The Weekly crude oil chart The Daily crude […]
Weekly Emini Minor Pullback
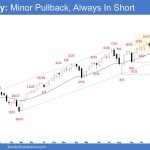
Market Overview: S&P 500 Emini Futures The market is forming a weekly Emini minor pullback. The bulls must create consecutive bull bars closing near their highs to show they are back in control. The bears want the pullback to be weak and sideways (overlapping candlesticks, doji(s), bear bars, long tails above candlesticks). S&P500 Emini futures […]

