Market Video Report: Bitcoin

Duration 18:18 mins.
Summary
Bitcoin‘s weekly chart is in a trading range after a two-leg move, with bulls triggering a High 2 nested double bottom while bears eye a $50,000 measured move. On the daily chart, price is coiling around the EMA in a tight trading range (Breakout Mode), teasing a massive swing. Professionals avoid guessing and wait for a confirmed breakout with follow-through or trade via options.
Weekly Chart
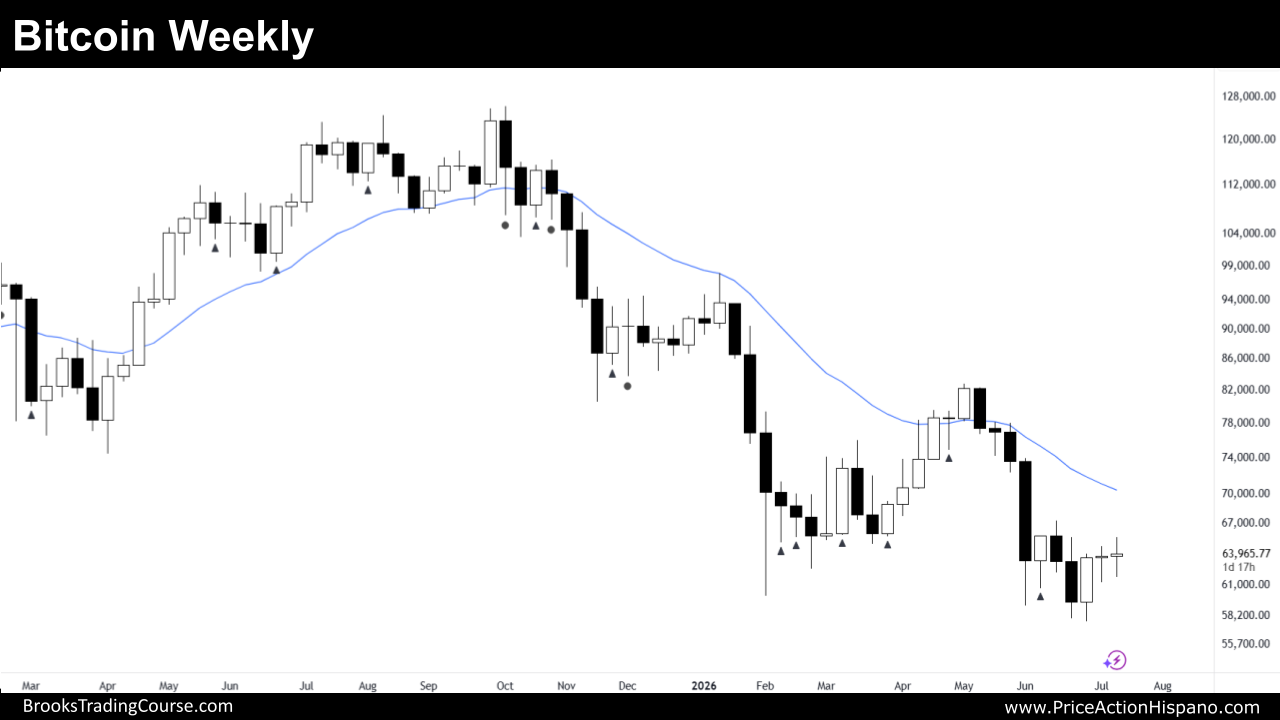
The weekly chart of Bitcoin has officially completed a two-legs market structure. In the Brooks methodology, once a clear price action structure concludes, the market typically enters a phase of discovery, searching for its next directional move within a trading range.
Whenever a market finds itself in a trading range following a completed two-leg move, the mathematical expectation shifts. The most likely outcome becomes a two-leg counter-structure on the opposite side. Therefore, looking at the macro picture, traders should naturally expect a two-leg structure moving sideways to up.
The Bear Thesis and the $50,000 Target
Despite the broader trading range context, the bears are aggressively pushing for a trend resumption. They interpret the recent price action as a legitimate bear breakout and are hunting for immediate bear continuation.
- The Setup: Bears view the current positioning as a high-quality Low 1 short entry setup following a powerful bear breakout.
- The Objective: Having already achieved decent bear follow-through, their ultimate target is a measured move downward. This calculation is based upon the height of the preceding bull leg, which establishes a technical downside target toward the $50,000 area.
The Bull Counter-Arguments and Structural Weaknesses
While the bear case appears strong on the surface, a deeper price action analysis reveals several critical structural flaws that favor the bulls:
- The Third-Leg Phenomenon: The current downward push represents a third leg down. Professional price action traders are historically wary of selling or trading in favor of a breakout when it occurs on a third leg, as these moves are highly prone to exhaustion.
- Closure of the Breakout Point Gap: Most importantly, the bulls have successfully closed a critical bear breakout point gap. This is the gap left behind when bears broke decisively below a previous major swing low. By trading back above this level, the bulls eliminated the gap. This proves that any bull who bought with a limit order underneath that low was able to make a profit by scaling in lower, or at least exit at total break even. Because these limit-order bulls were rescued and rewarded, they are highly likely to repeat this exact buying behavior below future lows, significantly reducing the market’s downside potential.
- Trend Line and EMA Breaches: The bulls managed to break above the major bear trend line drawn across the lower highs, as well as the exponential moving average (EMA), which functions as a dynamic trend line. Although the bulls ultimately failed to sustain immediate upside momentum, the act of breaking these levels significantly weakened the underlying bear momentum. Bears who sold at the absolute lows are now disappointed; they will likely look to cover and sell higher next time rather than pressing shorts at the bottom. Consequently, bears selling at current low levels face a massive structural risk of selling the exact bottom of the market.
Current Weekly Signals and the Trader’s Equation
The bulls are currently interpreting the chart as a nested double bottom. This consists of a large double bottom formed by two major swing lows, containing an internal micro double bottom within the current price structure.
- Signal Evolution: Following a bull reversal from a bear breakout, an inside bar formed, triggering a High 1 bull signal. The market then experienced a temporary bear trend resumption, which was quickly met by another bull reversal bar. When the subsequent bar traded above the high of this reversal bar, it triggered a formal High 2 buy signal.
- The Struggle for Control: Despite these signals, the bulls do not possess macro control over the market yet. They only established temporary, short-term control at the open of the recent bull reversal bar. To prove they have the strength to test the major lower high of the bear swing, bulls must achieve a daily/weekly close above the red line—defined as the highest open printed after the bear trend resumption down. Failure to close above this level followed by a swift reversal downward would transform this entire setup into a simple bear flag, exposing the market to severe downside.
- Evaluating Risk vs. Reward: Mathematically, the High 2 signal bar is a low-probability trade, offering roughly a 40% chance of successfully rallying to visit the major lower highs. However, because the target is so far away, the setup offers an exceptional risk-reward ratio. This combination of low probability and massive upside yields a mathematically positive trader’s equation.
The Professional Trade-Off: While buying the High 2 is theoretically justified, conservative traders who demand high probability should wait for a strong bull bar to close near its high, confirming a “High 2 plus follow-through” pattern. This confirmation increases the probability of success, but because the entry point is higher, the total financial risk increases. In price action trading, if you demand low risk, you must accept low probability; if you demand high probability, you must accept higher risk.
Daily Chart
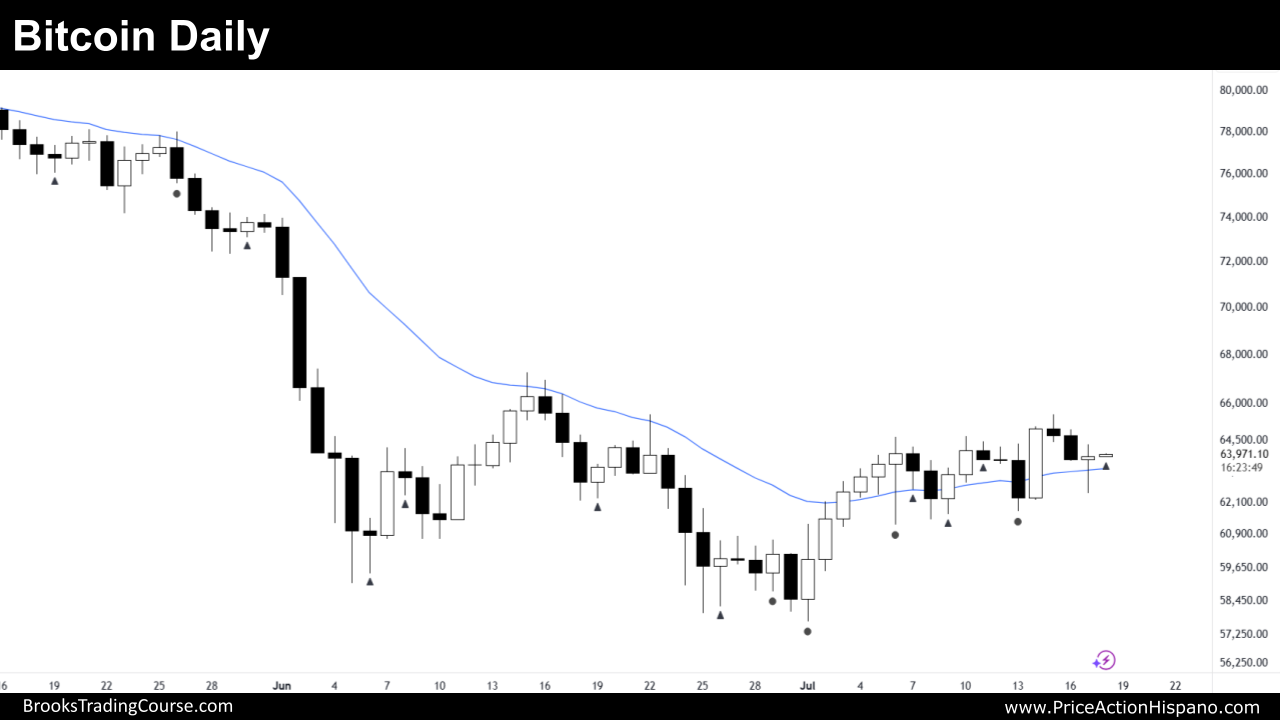
Transitioning to the daily chart, the overarching objective for the bulls has been confirming a two-leg-up structure emerging from a definitive double bottom.
Recent Traps and Failures
Previously, the daily chart printed a double signal confirming a transition into a second leg up, marked by a double bottom after a clean bull leg and a strong bull reversal follow-through bar.
During this sequence, an I-O-I (Inside-Outside-Inside) candlestick pattern formed, which initially triggered a theoretical bear short signal. However, the bears failed instantly when the market moved exactly one tick above the high of the bull outside bar.
Bears who shorted beneath that signal bar were caught in a trap and forced to buy back their positions at break even during the subsequent drop. This capitulation created a strong responsive bull bar. Meanwhile, bulls who maintained a protective stop loss safely below the minor higher low of the micro double bottom were never stopped out.
The Tight Trading Range (TTR) at the EMA
Despite that bullish victory, the market has since printed multiple overlapping reversals, binding the price into a tight trading range (TTR) extending for more than 10 bars. This structural gridlock places Bitcoin in a textbook 50/50 Breakout Mode scenario.
While there are subtle hints of bullish pressure—specifically, the bulls successfully defended their minor higher low while bears failed to protect their minor swing highs—traders must remain defensive. Tight trading ranges are notorious for closing gaps and generating brutal, consecutive breakout failures for both buyers and sellers.
The most compelling technical attribute of this daily pattern is its location: the breakout mode structure is coiling directly around the exponential moving average (EMA).
Whenever a highly balanced, tight trading range compresses directly on top of the EMA, the market is building extreme potential energy. The definitive expectation for this pattern is a violent, sustained swing away from the moving average. Given the macro context, the market appears to be gradually accepting these higher price levels, hinting at an eventual upside resolution. However, this is far from a guarantee, and probabilities remain far more balanced than retail analysts suggest. This specific structural location is fully capable of delivering a massive $10,000 to $15,000 move in either direction.
Execution Strategies
Because the immediate breakout direction from a 10+ bar TTR is fundamentally a coin flip, directional guessing is highly discouraged. Traders should utilize two objective professional strategies:
Strategy 1: The Options Market (Long Straddle)
For traders who want to capitalize on a massive expansion of volatility without directional bias, the options market provides an elegant solution via a Long Straddle.
- Execution: Simultaneously purchase an at-the-money (ATM) put option and an at-the-money (ATM) call option.
- Mechanics: If Bitcoin executes a massive, explosive breakout in either direction, the losing option faces strictly limited risk (it can only drop to zero), while the winning option captures theoretically unlimited profit potential as the trend extends.
- The Trade-Off (The Enemy): Time decay (theta). A long straddle is a decaying asset. The more time Bitcoin spends grinding sideways inside the TTR before initiating the breakout, the more premium and value both options will lose daily.
Strategy 2: Pure Price Action Confirmation
For directional spot or futures traders, the gold standard is patience. You must wait for the market to reveal its hand via a confirmed breakout sequence.
- For a Bull Breakout: Do not buy the initial poke above the range. Wait for a definitive breakout above the trading range high plus explicit follow-through (a second consecutive strong bull bar closing near its high).
- For a Bear Breakout: Wait for a clean breakout below the trading range low plus explicit follow-through before initiating shorts.
- The Fade Strategy: Alternatively, wait for a breakout attempt to completely fail and show immediate, aggressive follow-through in the opposite direction. This allows you to trade the failure and bet that the market will rocket toward the opposite side of the structure.
Final Absolute Warning: Under no circumstances should you attempt to “buy low and sell high” within the internal boundaries of this tight trading range. The structural risk of an imminent, volatile breakout is extraordinarily high. The only logical course of action is absolute patience—wait for a confirmed successful breakout, an explicit failed breakout, or deploy a defined-risk options straddle.
Market analysis reports archive
You can access all weekend reports on the Market Analysis page.


