Market Overview: Weekend Market Analysis
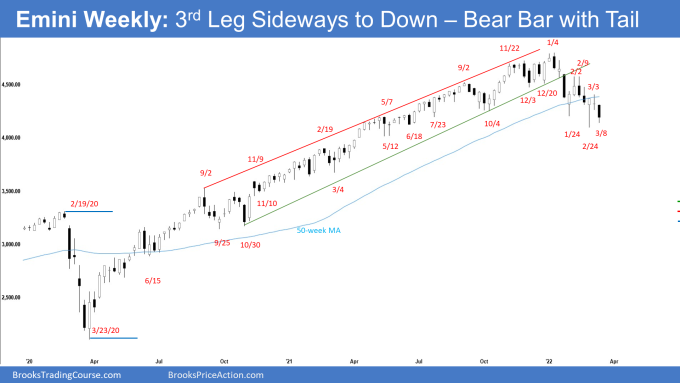
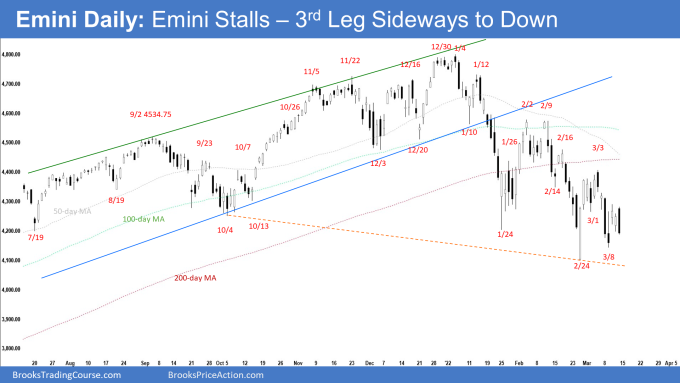
The SP500 Emini futures stalled and formed the 3rd leg sideways to down. Bears want a strong break below the February 24 low followed by a measured move down. They need next week to close as another bear follow-through bar. If they get that, the odds of a breakout below February 24 low increases. However, even then, odds slightly favor that the 3rd leg down will lead to a wedge bull flag rather than a bear trend. They will need to create consecutive strong bear bars closing far below February low to convince traders that a successful breakout is underway.
The bulls want the 3rd leg sideways to down to reverse higher from around or below the February 24 low or below the 4,000 Big Round Number from a wedge bull flag (January 24 and February 24). If they get a strong reversal up from below the February 24 low, odds of a re-test of the February 2 high increases.
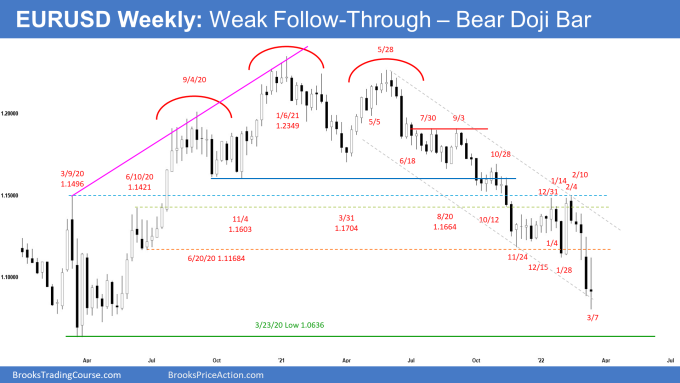
The EURUSD Forex reached the bear 700-pip measured move this week which started in October 2021. Another bear measured move based on the height of the 4-month trading range (Nov 2021 to Feb 2022) will take them to around 1.072 which is very close to the March 2020 low. The bulls hope that the 4-month trading range is the final flag of the bear leg and want the breakout below to reverse higher from around last year’s low. For now, odds slightly favor a 2nd sideways to down leg after a pullback (bounce).
S&P500 Emini futures
The Weekly S&P500 Emini chart

- This week’s Emini weekly candlestick was a bear bar with a noticeable tail below. It triggered the low 1 sell signal bar by trading below last week’s low for a possible Small Pullback Bear Trend that began with the January all-time high.
- We have said that the bears may get another leg lower after a brief bounce, especially if the bulls fail to get strong follow-through buying within 1-3 weeks following the bounce from the February low.
- The Emini will then form a lower high or a double top bear flag with February 2 followed by a 3rd leg sideways to down. If it does, traders will then monitor the strength of the sell-off. This week formed the 3rd leg sideways to down.
- Last week, Al said that the Emini will probably trigger the weekly sell signal by trading below this week’s low. It might fall to around 4200 and test the January 24 low. The Emini closed just slightly above 4200 this week.
- We have also said that if that were to happen, the bears would then want a strong breakout below the February 24 low and a measured move down to 3600 based on the height of the 7-month trading range. The bulls on the other hand would want the 3rd push down to be a wedge bull flag where January 24 and February 24 were the 1st 2 legs down. This remains true.
- The bears will need to create a follow-through bar next week to increase the odds of a break below the February 24 low. If that were to happen, the Emini might dip below 4,000.
- The bears want a reversal down following the head & shoulders (H&S) top where the lower high (February 2) is the right shoulder, but an H&S top is often a minor reversal pattern. The 3rd push down from the right shoulder often is the 3rd leg in what will become a wedge bull flag (October 4, January 24 and February 24).
- The bulls see the selloff in January – February, and possibly March as a long-overdue pullback. If the 3rd leg down trades below February 24 low, odds are there will be buyers below. Odds slightly favor a wedge bull flag forming rather than a reversal into a bear trend for now.
- The bulls want next week to be a bull bar even though the Emini may trade lower first. If they get a big bull bar closing near its high, the odds of a test of the February 2 lower high increases.
- For now, odds slightly favor sideways to down for next week. Traders will be monitoring whether the bears get a follow-through bear bar followed by a subsequent breakout below February 24 low, or if the bulls get a strong bull reversal bar closing near its high.
- If there is a new low in March, odds are traders will buy it. A third reversal up would then create a wedge bottom and would usually lead to a stronger bounce.
- However, if the bears get consecutive bear bars closing near their lows trading far below February 24 low, odds of a deeper pullback increase.
Further comments by Al Brooks
- Al said that the Russian war and next Wednesday’s FOMC announcement create uncertainty, and uncertainty usually results in a trading range.
- Everyone knows the Fed will raise interest rates on Wednesday. Everyone knows the increase will be 0.25%. So where is the uncertainty? The statement. Will the Fed say they will raise rates for each of the next 6 meetings, or will they say they will wait to see what happens and then decide at the next meeting?
- The war has uncertainty as well. Putin does not want it to end until he kills Ukraine’s president and installs a puppet.
- Also, will Putin use chemical weapons or a tactical nuclear weapon? While western logic says no, he has always been a gambler.
- Putin will bet that it would anger the west and create conflict in NATO, which would make him happy.
- Also, he bets the west would not have any sanctions left and therefore there is no downside. The market knows this.
- If he does it, the market move will be sharp but probably brief. The west has decided not to send troops into Ukraine no matter what.
- Putin wants the west to send troops so that he would have a justification for continuing west and retaking all the previously Soviet countries.
- The west won’t bite. Also, they will fight if Putin invades a NATO country, and Putin will lose disastrously.
- He probably would use tactical nuclear weapons, correctly betting the US will not use them in return out of fear that they will become an acceptable military weapon.
The Daily S&P500 Emini chart

- The Emini traded lower and tested below the January 24 low on Tuesday, pulled back slightly, followed by Friday closing as an outside bear bar at the low.
- Last week, we said that traders will be monitoring if the bulls can create strong follow-through buying or if the Emini stalls at some resistances above such as around the February 2 high or the 50-day, 100-day or 200-day moving averages area.
- That bears want the pullback (bounce) to reverse lower from a lower high or from a double top bear flag with the February 16 high or February 2 high. If the bears get that, they then want a measured move down to around 3600 based on the height of the 7-month trading range.
- If the 3rd leg sideways to down forms, but it is weak and reverses up from below the February 24 low, it would then form a wedge bottom from below the 8-month trading range. A 3rd reversal attempt has a higher probability of working.
- This week formed the 3rd leg sideways to down. So far, the 3rd leg sideways to down has overlapping bars and does not look as strong as the 1st leg down in January or the 2nd leg down in February where both were in tight bear channels with minimal overlapping bars. Can next week form a stronger leg down? Yes. The February 24 low is a magnet and traders may not be willing to buy aggressively until the February low is adequately tested.
- Last week, Al said that the buying interest following the February low has been weak which was likely due to the large stop loss (below February 24). The Emini may have to trade lower, probably towards the January 24 low to find more buyers. They should come in above the February low and create a higher low major trend reversal.
- Al said that the reversal up from Tuesday’s low has not been strong. Therefore, this is not behaving the way a successful higher low major trend reversal typically behaves. Consequently, the daily chart is less bullish than it was in late February.
- The bears want a strong breakout below February 24 low followed by a measured move down. They want consecutive big bear bars breaking far below the February 24 low. If they get that, the odds of a test of the 4,000 Big Round Number and lower increases.
- The bulls want a reversal higher from a wedge bull flag where the first two legs are the January 24 low and February 24 low even if the Emini trades below February 24 low or 4000 first.
- Since Friday was an outside bear bar closing near the low, it is a strong sell signal bar for Monday. It increases the odds of a gap down on Monday. Small gaps often close early.
- Odds slightly favor sideways to down for next week. Traders will be monitoring whether the bears are able to create consecutive bear bars closing near their lows and far below the February low. If they get that, the odds of a deeper pullback increase.
- However, if next week trades lower but reverses higher with big bull bars closing near their highs from around or below the February 24 low, odds of a bounce higher from a wedge bull flag increase.
- Al said that there is a 50% chance of a break below the February low and only a 30% chance that the selloff will continue down to the pre-pandemic high of Feb 2020.
EURUSD Forex market
The EURUSD weekly chart

- This week’s candlestick on the weekly EURUSD Forex chart was a bear doji with prominent tails above and below. It traded below last week’s low but did not get a strong bear close. It was a weak bear follow-through bar.
- We have said that the bears want a continuation of the 700-pip measured move lower based on the height of the yearlong trading range (August 2020 to August 2021) to around 1.0855. The EURUSD reached the measured move this week.
- Another bear measured move based on the height of the 4-month trading range (Nov 2021 to Feb 2022) will take them to around 1.072 which is very close to the March 2020 low.
- The bulls hope that the 4-month trading range is the final flag of the bear leg and want the breakout below to reverse higher from around last year’s low.
- The bulls will need to create strong consecutive bull bars closing near their highs to convince traders that a reversal higher may be underway.
- We have said that if there is a bear breakout below the 4-month trading range, the bulls will make another attempt at a bottom around the March 2020 low. That could be a higher low double bottom in the 7-year range, and the current 4-month tight trading range would then be a likely Final Bear Flag. This remains true.
- Al has said that the geopolitical uncertainties (Russia’s invasion of Ukraine) could lead EURUSD to test the bottom of the 7-year trading range, especially if Europe handles it poorly.
- This week overshot the trend channel line slightly. The doji bar indicates trading range price action. There is an increased chance of sideways trading into Wednesday’s FOMC announcement.
- Al said that this week’s high got to within a fraction of a pip of the January 28 low, which was a breakout point. Since this week’s rally reversed down from below that high, there is a gap. That increases the chance of a break below the March 7 low and a test of last year’s low.
- The leg down from February is strong enough for traders to expect at least a small 2nd leg sideways to down after a pullback (bounce).
Trading Room
Traders can see the end of the day bar-by-bar price action report by signing up for free at BrooksPriceAction.com. I talk about the detailed Emini price action real-time throughout the day in the BrooksPriceAction.com trading room. We offer a 2 day free trial.
Weekly Reports Archive
You can access all weekly reports on the Market Analysis page.