Emini and Forex Trading Update:
Tuesday March 10, 2020
I will update again at the end of the day.
Pre-Open market analysis
I started day trading a month before the 1987 Crash. After the Crash, the exchanges created rules that they hoped would prevent further crashes. They began to halt trading during any day once the stock market fell a certain percent.
There were many limit down moves over the next few years, and the exchanges modified the rules many times. They might modify them again at any time.
Will we get more limit down moves over the next month? Back in the late 1980’s and early 1990’s, they came in clusters. They obviously are more likely when the daily ranges are huge. So, yes, we might see more.
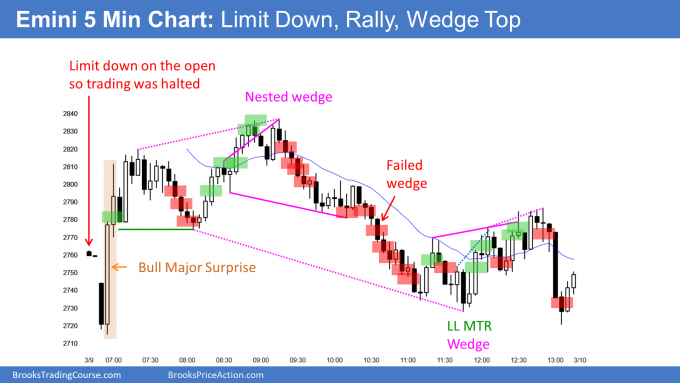
Yesterday, the Emini was in a trading range between the day session 7% limit down level and the Globex 5% limit down level. It closed near the open and formed a doji bar on the daily chart.
The market is very oversold on the daily chart. Traders should expect a sharp bear rally to begin within a week. It could begin today.
The importance of 20% down
Yesterday’s Emini low of 2715.00 was exactly 20% down from the all-time high. Exact to the tick. The computers clearly bought there so it is important support for traders. But institutions use the closes on the cash index to define a bear market.
What happens after a 20% selloff?
Whether or not the bear rally begins today, the cash index will probably close below 2708.92 soon. That is 20% down from the highest close and it would signify that the S&P500 is in a bear market.
Once the market falls 20%, the average final lowest close is about 28% below the all time high close. It comes about 4 months after the high on average. Also, if it happens, it takes about 2 years to get back to the old high.
But there is an added problem here for the bulls. There were extreme buy climaxes in 2017 and 2019. Both were late in a bull trend. Traders should expect that the stock market to be in a trading range for 10 years. Price got far above fundamentals and it will take about a decade for fundamentals to catch up. Therefore, if there is a new high, it probably will not get far above the current high.
Overnight Emini Globex trading
The 3 week sell climax has been unusually extreme. It reversed up yesterday at support. There is now a double bottom on the 5 minute chart with yesterday’s 2 lows.
A measured move up would be around Friday’s high. A move above Friday’s low would close the gaps on the daily and weekly charts. That would erase one sign of strong bears. It would also increase the chance of a bear rally, which could last a week or two.
Traders expect the bears to cover some shorts soon. Short covering rallies can be very strong. That increases the chance of one or more bull trend days this week.
Can today be another big bear day? Probably not. If today sells off, the selloff will more likely be a bear leg in a 2 day trading range than a resumption of last week’s bear trend. The odds favor a profit taking rally to begin this week.
Yesterday’s setups

Here are several reasonable stop entry setups from yesterday. I show each buy entry with a green rectangle and each sell entry with a red rectangle. I rarely also show limit order entries and entries on the close of bars. Buyers of the Brooks Trading Course and Encyclopedia of Chart Patterns have access to a much more detailed explanation of the swing trades for each day.
My goal with these charts is to present an Always In perspective. If a trader was trying to be Always In or nearly Always In a position all day, and he was not currently in the market, these entries would be logical times for him to enter.
If the risk is too big for your account, you should wait for trades with less risk or trade an alternative market like the Micro Emini.
EURUSD Forex market trading strategies

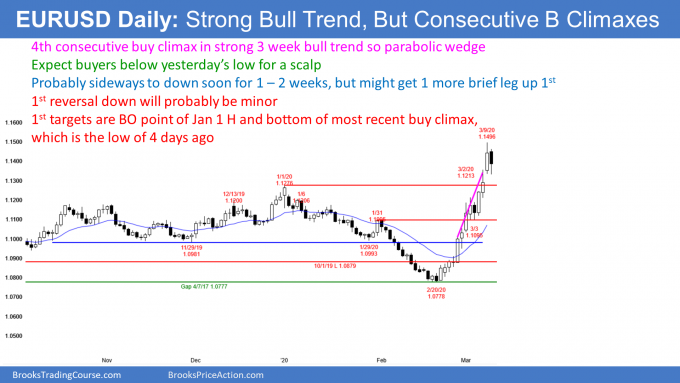
The daily chart of the EURUSD Forex market has rallied strongly for 4 weeks. There have been 4 surges. Each is one or more big bars followed by one or more smaller bars. Three or more surges mean that the rally is a parabolic wedge buy climax. That typically attracts some profit taking.
But it is also a sign of strong bulls. Today went below yesterday’s low. It was the 1st pullback in 13 days. The rally is therefore also a 13 bar bull micro channel. Traders have been so eager to buy that they have been buying above the prior day’s low for 13 days. They finally got an opportunity to buy a pullback.
Profit taking should create minor reversal soon
The bulls typically take that buy, expecting at least a scalp. However, it is the 1st sign that the strong bull trend is weakening. Bulls will take more profits soon because their stop is too far below. That creates too much risk. The easiest way to reduce risk to to take some profits. Consequently, traders should expect a couple weeks of sideways to down trading to begin within the next week.
The pullback usually tests the bottom of the most recent buy climax. That is the low of 4 days ago. It also typically tests the 20 day EMA and one or more breakout points. The most obvious is the January 1 high.
The bears will probably not be able to create a bear trend without 1st forming a trading range. Traders should expect that bulls will buy the 1st 1 – 2 week selloff for either a test of this week’s high or for a resumption of the 4 week bull trend.
Overnight EURUSD Forex trading
The 5 minute chart of the EURUSD Forex market sold off early in the Asian session. It fell below yesterday’s low overnight. However, this bear breakout was only 2 pips. Traders bought at yesterday’s low the the EURUSD rallied 50 pips.
The European session has been in a trading range for 6 hours. Day traders are scalping. The legs up and down are big enough for 20 – 30 pip scalps.
The bulls want another bull candlestick on the daily chart. However, the open of the day is probably too far above.
Alternatively, they do not want today to close on its low and below yesterday’s low. That would increase the chance of lower prices again tomorrow.
At a minimum, they would like today to close above its midpoint. If they are successful, they will have a better chance of at least one more brief leg up for 1 – 3 days before there is a bigger profit taking pullback.
The bears always want the opposite. They want a bear trend reversal. They know that is unlikely. But they will have a better chance of a minor reversal for a couple weeks if they can start to get some days closing near their lows.
With the past 6 hours being sideways, today will probably remain in a trading range. Day traders will look for reversals.
Summary of today’s S&P Emini futures price action and what to expect tomorrow

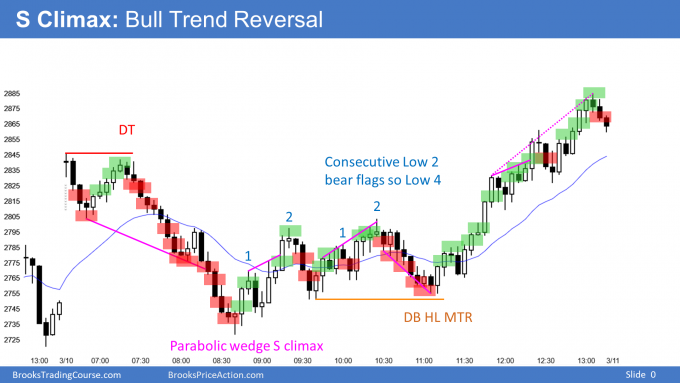
Here are several reasonable stop entry setups for today. I show each buy entry with a green rectangle and each sell entry with a red rectangle. I rarely also show limit order entries and entries on the close of bars. Buyers of the Brooks Trading Course and Encyclopedia of Chart Patterns have access to a much more detailed explanation of the swing trades for each day.
My goal with these charts is to present an Always In perspective. If a trader was trying to be Always In or nearly Always In a position all day, and he was not currently in the market, these entries would be logical times for him to enter.
If the risk is too big for your account, you should wait for trades with less risk or trade an alternative market like the Micro Emini.
End of day summary
The Emini opened just above yesterday’s high. After a double top, it sold strongly and almost fell below yesterday’s low. Today was an Almost Outside Down day.
After a selloff, the initial reversal up was minor. The Emini entered a trading range for a few hours. It formed a double bottom higher low major trend reversal, and then rallied back to the high in the final 2 hours. There is now a micro double bottom on the daily chart. Today is therefore a buy signal bar for tomorrow.
Traders are deciding whether yesterday’s double bottom and today’s double bottom pullback is the start of a 3 – 5 day short covering rally up to last week’s lower high above 3100. There might be one new low and a wedge bottom first. In either case, traders should expect at least a couple strong bull trend days within the next week. Also, the short covering could last more than a week.
See the weekly update for a discussion of the price action on the weekly chart and for what to expect going into next week.
Trading Room
Traders can see the end of the day bar-by-bar price action report by signing up for free at BrooksPriceAction.com. I talk about the detailed S&P Emini futures price action real-time throughout the day in the BrooksPriceAction.com trading room. We offer a 2 day free trial.
Charts use Pacific Standard Time
When I mention time, it is USA Pacific Standard Time (the Emini day session opens at 6:30 am PST, and closes at 1:15 pm PST). You can read background information on the intraday market reports on the Market Update page.