The support forum is built with (1) General and FAQ forums for common trading queries received from aspiring and experienced traders, and (2) forums for course video topics. How to Trade Price Action and How to Trade Forex Price Action videos are consolidated into common forums.
Brooks Trading Course social media communities
Brooks Trading Course Learning Resources >>>

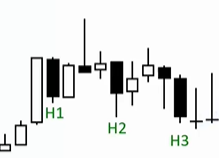
This is taken from slide 24. I am struggling to grasp bar counting.
I will just discuss high bars to keep things simple with the assumption that L1/L2 etc are just the opposite.
My current understanding is, for a bar to be labelled a highX, the bar after it must go above the high of that bar.
But in the above example, not one of the proceeding bars is a tick above the bar marked Hx. Especially the high 3, the proceeding bar is completely below it?
Apologies for my confusion, but i have looked through the videos and read the section in the book, but i am still really struggling to understand. I thought i had it, when i read from that book (Trading ranges book, page 259) "when the current bars high extends at least one tick above the high of the prior bar".

I guess you are same guy/gal asking same question on Discord, albeit with different chart and H1/H2?? Anyway, here is my reply:
"I have been asking Al to update his definitions for some time now. If the signal bar close is above previous bear bar close it is also a High 1/2."
In the case of the H3 here, it is the high of signal bar above prior bar close. Confusing yes, but a pullback nonetheless.

"I have been asking Al to update his definitions for some time now. If the signal bar close is above previous bear bar close it is also a High 1/2."
This helps a lot to clear confusion. @ludopuig @BTC Admin (Richard) Just a thought maybe we can add this sentence "If the signal bar close is above previous bear bar close it is also a High 1/2." as a text on this chart to help traders avoid confusion.
I was also confused by this definition in the video course and spent a lot of time spending understanding and finally I adapted my own version of understanding of H1/H2 which was close to what was described in the video course.

To me a H1 is the first attempt to resume the bull trend after a pullback. In that slide I would label that inside bull bar after that first bear bar as the H1 setup since the bear bar, although it didn't go below the prior bar, does serve as a pullback. The other setups would be the same for me.

Hi @BTC Admin,
"If the signal bar close is above previous bear bar close it is also a High 1/2."
The signal bars you are referring to are bear bars in the pull back? And if the close of these bars are above their previous bear bar close, then they are marked H1/2?

Glad I'm not the only one struggling with this.
On page 389 in the glossary of "Reading Price Charts Bar by Bar", Al says, and I quote, "High 1, 2, 3, or 4. A High 1 is a bar with a high above the prior bar in a correction in an up or sideways market. If there is then a bar with a Lower High, (it can occur one or several bars later), the next bar in this correction whose high is above the prior bar's high is a High 2. Third and fourth occurrences are a High 3 and 4. There are other variations as well."
Al also mentions this definition in video 09A @ 25:16
So here is my labeling of his chart.
Love to get this sorted. So frustrating.

I would use a different interpretation.


My take at it 🫡


Bar counting sometimes is up to one's interpretation , there's no really right or wrong. You can do it the way you did it or the way others did it. I think Al considered that bull bar with the tail on top ( after your h1) as the end of a new leg hence he reset the counting.( Your h1 was Al's h1 but of the previous big bull leg)
What it matters though is the bigger picture: a h2 failing could be a warning and it's risky buying a h3, h4 in a tight bear channel (like the one it's forming in the pic)


I don't think there should be interpretation, there should be a more specific definition. One of the reasons the books were very challenging for me as there were consistency issues with this particular item, and it seems very important. But maybe it isn't? But that's never mentioned from what I recall that there is wiggle room.
Everything in trading is a shade of grey. Context can make a great looking setup bad and probability can make a bad risk/reward ratio good. As I've said before, the concept of Hs & Ls is an attempt to resume the trend after a pullback. A valid attempt will not always go beyond the prior bar and make itself easy to see. For example, inside bars with big tails often hide that type of price action. That is why looking at a smaller time frame can show what may not be evident on the time frame you are trading.

I am still struggling with bar counting. Ironically, bar counting is suppose to help instead of creating the opposite - confusion. Al should give a definitive explanation .

Fred's chart makes sense to me.


I had a lot of trouble to with bar counting, and it might gets better if you understand some thing about the pattern and the size of the pattern.
If you think about it in the Way of patterns a DT is a L2 - because the 1st Push from the DT is a L1 - followed by a Leg down creating a Neckline - next push up above the neckline low fomrs the L2
This is a Pattern example of a L1 & L2 in a DT, below i did a visual example of how i count the legs the difference is, how big is the pattern, both the DT & the MDB are on the 5min chart, both have the same energy and work the same, vut the bigger one is counting with bars above and bars below, the MDB is the same pattern if you go to lower time frame.

I can recommend using channel lines, draw channel line on every chart to understand, to get your point of view, your drawing might be logic for you.
What really made me sleeples night were Wedges and counting wedges.
Here is an Example of how i count on a bigger chart and hopefully can explain it:

The First H2 was because of the Gap up, a Gap up is a Spike Up - and if you take the example above and would look on the lower time frame, the first two bars would be a H DT = a L2, but this low 2 failed an created a H2 or a H1 if you think about in a bigger sized pattern with bars going above or under. In my opinion i made the B1 a H1 and B3 the H2 because B3 did not trade above the B2 high (if that would be the case B2 would be a H2).
If you go to B3, this bar was a L DB with B1, that means a Lower DB is a H1 & H2, so B3 was the 2nd push down from the L DB = th H2
The open Pattern created a L DB and was followed by a Bull Breakout, with the B4+B5+B6, three consecutive Bull Trend bars, small tails, above th MA, looking strong.
A important point for me was to understand that after a BO like this the count goes to zero, that way is easyier for me to count.
After the BO a wedge with three pushes up followed, a wedge is some type of L1+L2+L3, mos of the time the L3 suceed, the L3 is alos the 3rd push to the Channel line in this wedge above, if your looking for counter trend trades.
If you want to go with trend (what would be wiser after this BO), B9 was a H1, this one failed and created a H2 with B11(a doji bar not a good SB), this one failed to an created a H3. The H3 suceed and had a BL BO bar.
If your are really perfect B14 was the 3rd push to the Channel line, the possible L3 or a Wedge Top, but B15 reversed the B14 L3 and created another 3 Pushes up, this three pushes up would be the 4th push to the Channel line and the two pushes from the MDT.
Hopefully this example is logical for you, this is the only way for me to make sense to count Legs and pushes...
Another interssting thing is that what follows the MDT. A smaller version of a spike and Channel trend like the examople above explained only in the bear direction. and the market had a bear Bo with B26 and not a reversal like on the spike and channel in the beginning.
The main point what i wanted to say is this two patterns are the same, a spike and channel trend, the difference is only the size, the first is good visible and the second is small and bars had big tails. But it was the same energy. If your not sure about what are inside the bars i can recommend using the 100 sec chart and drawing lines between H & HH or L & LL after BO, Patterns are all the same all time frames.
Hopefully its helps someone, feel free to ask if something is unclear. 🙂


