The support forum is built with (1) General and FAQ forums for common trading queries received from aspiring and experienced traders, and (2) forums for course video topics. How to Trade Price Action and How to Trade Forex Price Action videos are consolidated into common forums.
Brooks Trading Course social media communities
Brooks Trading Course Learning Resources >>>

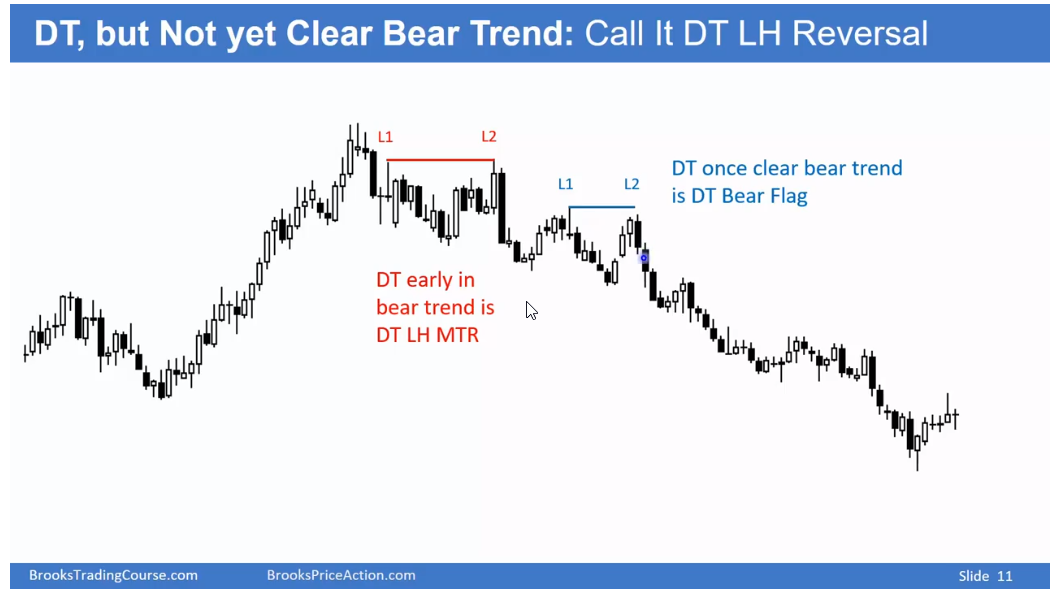
This chart focuses on Al teaching about Double Top Reversals in a bull trend and Double Top Bear Flags in a bear trend. He emphasizes that whether it's a double top reversal in a bull trend or a double top bear flag in a bear trend, the trading approach remains the same (which I've grasped).
However, I have a question:
Considering the strong bull trend context before the first set of L1, L2, why are we even considering looking to short at first set of L1 and L2 (wouldn't this be a low probability trade considering preceding bull trend?). Couldn't this just be a pullback in a bull trend, and traders might consider buying instead. Couldn't this downward movement from the first set of L1, L2 to the second set actually be a large wedge bull flag?
Al also mentions in earlier videos that if a pullback extends over 20 or more bars, the probability of the trend resuming upward is equal to the probability of it resuming downward. So, I can comprehend the idea of selling below the second set of L2s assuming couple of prior lower highs hence a bear trend.
Sudeep


