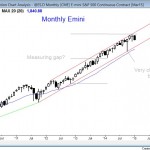
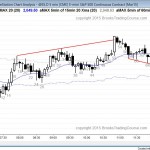
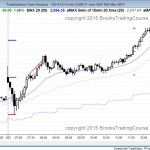
Monthly S&P500 Emini candle chart: Sell signal bar in overbought bull trend The monthly Emini candle chart formed an ioi setup with this month’s close on Friday. Since the monthly candle chart is overbought and at the top of the channel, this bear signal bar increases the chances of a profitable short on a breakout […]
Emini weekend update: January 31, 2015:
Intraday market update, January 30, 2015:
Buy climax yesterday so a pullback today is likely
Posted 6:50 a.m. The Emini opened with a big gap down. Big up yesterday, big down today means big confusion and increases the chances of a trading range. The second and fourth bars were bear bars. This is bad follow-through after the strong bull bars, and that increases the chances of a trading range. Yesterday […]
Intraday market update, January 29, 2015:
Sell climax so a minor trend reversal is likely

Posted 7:37 a.m. There was some initial follow-through selling, but the bulls are still looking for a two hour rally. They do not yet have a credible bottom, nor do they have a bull breakout. They need a better bottom or a bull breakout. Otherwise, the bears might get a bear breakout below the tight […]
Intraday market update, January 28, 2015:
Breakout mode and there is an FOMC report
Posted 6:54 a.m. The Emini opened in a limit order market. Since the market is in the middle of a 3 week trading range, it is in breakout mode, and there is an FOMC report at 11 a.m. There was disappointing follow-through from the initial reversal down, and the reversal up has not been strong […]
Intraday market update, January 27, 2015:
Double top bear flag
Posted 6:57 a.m. The Emini opened with a big gap down, but had early trading range price action. This often is the start of a sideways to up move to get closer to the moving average. At that point, the Emini decides between an opening reversal down and a trend up. The downside is probably […]
Intraday market update, January 26, 2015:
Pullback before another breakout attempt
Posted 6:51 a.m. The Emini opened with the biggest bear trend bar of a 30 bar bear trend. This was more likely an exhaustion gap than a measuring gap. However, when the channel is as tight as it is, the first reversal up usually forms a trading range and not a trend reversal. The bulls […]
Weekly Forex update, January 24, 2015:
Sell climax and an exhaustion gap
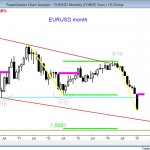
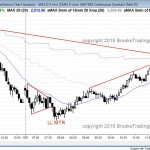
Monthly Forex EURUSD candle chart: Strong bear breakout below head and shoulders bottom The monthly EURUSD Forex chart is in a strong breakout below a head and shoulders bottom. A failed bottom usually falls for at least two legs and it typically reaches a measured move projection. The monthly Forex EURUSD candle chart is breaking […]
Emini weekend update: January 24, 2015:
Double top and double bottom on the daily chart
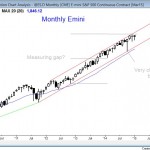
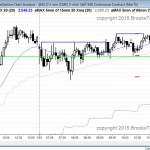
Monthly S&P500 Emini candle chart: Strong bull trend, but overbought The monthly Emini candle chart is in a strong bull trend, but it is very overbought. The monthly S&P500 Emini candle chart is in a strong bull trend, but it is very overbought and probably will have a 20% correction at some point this year. […]
Intraday market update, January 23, 2015:
Buy climax that is testing resistance
Posted 7:06 a.m. The Emini opened with multiple reversals after yesterday’s buy climax. This is trading range behavior, which is typical after a buy climax. The rally yesterday was big enough so that there probably will be swing trades within the trading range, but at the moment, a trading range is most likely for the […]
Intraday market update, January 22, 2015:
Bull breakout of a wedge bear flag
Posted 6:45 a.m. The Emini broke above the top of the 5 day bull channel on the open. This is a wedge bear flag. It then reversed down, as expected. The bears are hoping for a bear trend day. The bulls would like the selloff to be a bear leg in a trading range. If […]

