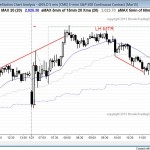
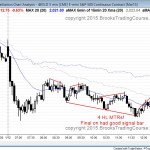
Posted 7:15 a.m. The Emini opened with a strong opening reversal up from the 60 minute moving average. However, as expected in a trading range, the follow-through was bad and the market reversed down from its breakout above yesterday’s high. Even though the second bar of the day was a huge bull reversal, this bad […]
Intraday market update, January 21, 2015:
Intraday market update, January 20, 2015:
breakout of a bull flag
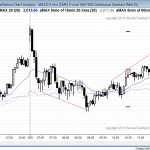
Posted 7:03a.m. The Emini reversed down strongly from above yesterday’s high and the top of yesterday’s bull channel and became always in short. However, yesterday’s rally was strong enough so that the bears will probably need a major trend reversal if this is to turn into a bear trend day. This means that there will […]
Emini weekend update: January 16, 2015:
bull flag on the daily chart
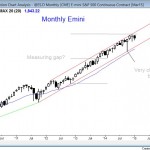
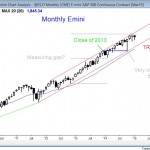
Monthly S&P500 Emini candle chart: Strong bull trend, but overbought The monthly Emini chart is forming an ioi breakout mode setup at the top of the bull channel, but in a very overbought bull trend. The monthly S&P500 Emini candle chart is still in a bull trend, but it is extremely overbought by at least […]
Intraday market update, January 16, 2015:
Breakout mode, testing support
Posted 6:50 a.m. The Emini reversed up from below yesterday’s low, but it did not yet break out above yesterday’s trading range. Until it does, the bears see the rally as a bull leg in broad bear channel. At the moment, it is always in long, but this is not helpful when the range is […]
Intraday market update, January 15, 2015:
Support at the bottom of the trading range
Posted 6:55 a.m. and I leave early today and tomorrow, Friday, and might not be able to post an end of the day update. The Emini ended yesterday always in long, but at the top of a spike and channel pattern. This usually evolves into a trading range. Today’s strong reversal down made the market […]
Intraday market update, January 14, 2015:
No post today because I am travelling
No post today because I am travelling. I will also only be trading for the 1st 2 hours on Thursday and Friday. Traders can see the end of the day bar-by-bar price action report by signing up for free at BrooksPriceAction.com. I talk about the detailed Emini price action real-time throughout the day in the […]
Intraday market update, January 13, 2015:
wedge bull flag within a 60 minute trading range
Posted 7:01 a.m. The Emini gapped above the 2 day wedge bull flag and opened with a big bull trend bar. It is always in long. However, the follow-through has been bad. This means bulls are taking quick profits, instead of buying above the high of the prior bar. If the bulls are not willing […]
Intraday market update, January 12, 2015:
60 minute chart is in a trading range
Posted 6:52 a.m. Yesterday ended always in short because of the selloff at the end of the day, but the 2nd half of the day was still a trading range. Today open within that trading range, which increases the chances of more trading range trading. However, the first four bars were big bear bars, and […]
Emini weekend update: January 10, 2015:
bull trend evolving into a trading range
Monthly S&P500 Emini candle chart: Overbought bull trend, forming more trading range price action The monthly candle chart is in an early tight trading range. This month so far is an inside doji candle and it follows last months outside doji candle. The monthly S&P500 Emini candle chart is in a strong bull trend, but […]
Intraday market update, January 9, 2015:
trend reversal or trend resumption.

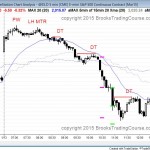
Posted 6:45 a.m. The Emini opened with a huge bear trend bar and that made the Emini always in short. It might bounce and test yesterday’s high, but at the moment, the odds are probably 50% or better that we have seen the high of the day. The head and shoulders bottom measured move target […]

