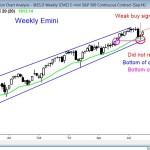
Even though this is called a Sunday update, I finished it early and posted after Friday’s close. The weekly S&P500 Emini candle chart had a strong enough reversal down from the top of the bull trend channel so that it is likely to have a second leg sideways to down to the bottom of the […]
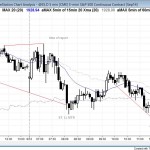
Intraday market update, Friday, August 15, 2014: daily lower high major trend reversal
I posted this chart after the close. After gapping up and forming an island bottom on the daily chart, the S&P500 Emini reversed down strongly in a sell vacuum that tested last week’s high. As I have said several times, last week was a weak buy signal bar when compared to the strong bear bar […]
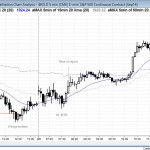
Intraday market update, Thursday, August 14, 2014: Emini wedge top and bear trend reversal
I posted this chart after the close. The Emini had a bull trend opening reversal at the moving average, and then it had a relatively weak rally in a broad bull channel. The 7:50 a.m. wedge top and bear trend reversal failed. At 10:20 a.m., there was an exhaustive buy climax top just below a […]
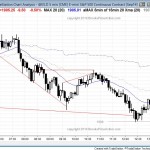
Intraday market update, Wednesday, August 13, 2014: head and shoulders bottom
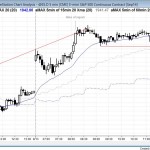
I posted this chart after the close. The bulls had a breakout above a two week double top, which is the neckline of a 60 minute head and shoulders bottom. However, the Emini entered a tight trading range for the rest of the day, with a little trend resumption up into the close. The close […]
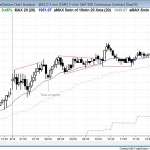
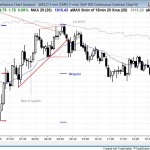
Intraday market update, Tuesday, August 12, 2014: breakout mode trading range open
I posted this S&P500 Emini candle chart after the close. The Emini had a trending trading range day and closed near the open of the day, and therefore formed a doji candle on the daily chart. The second leg down was a channel and therefore the day was also a spike and channel bear trend. […]
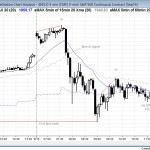
Intraday market update, Monday, August 11, 2014: Emini weekly buy signal

I posted this chart after the close. The Emini rallied above last week’s high and therefore triggered a buy signal on the weekly chart. However, the rally was weak, and very late in a 2 day bull trend. It was therefore likely to be part of a trading range and not a strong bull trend. […]
Emini weekly update: Sunday, August 10, 2014: trend reversal down in a bull channel
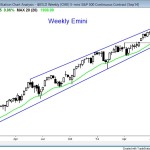
The weekly Emini candle chart is in a trend reversal down in a bull channel. It is finding support at the moving average and 1900, but the odds favor a move sideways to down to the bottom of the channel at a minimum. The Emini this past week found support at the 20 week moving […]
Intraday market update, Friday, Aug 8, 2014: major trend reversal
I posted this chart after the close. The Emini had a higher low major trend reversal after yesterday’s 4 day wedge bottom at key support levels. The breakout to a new high at 7:40 set the tone and was likely to remain the dominant feature for at least a couple of hours for day trading. […]
Intraday market update, Thursday, Aug 7, 2014: ABC bear flag
I posted this chart after the close. The Emini reversed down from above yesterday’s high in a big low 2 sell setup (an ABC bear flag). The strong bear breakout at 7:45 led to a bear channel, and the Emini entered a spike and channel bear trend. Bear trends are always forming wedge trend reversal […]
Intraday market update, Wednesday, Aug 6, 2014: bull trend reveral
I posted this chart after the close. The Emini today had a strong bull trend reversal up from below yesterday’s low, and it offered many buy setups for day traders. The Emini and S&P500 had 60 minute lower low major trend reversals. The Emini had consecutive buy climaxes up to the resistance of a measured […]

