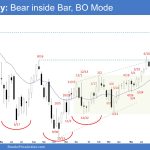
Market Overview: S&P 500 Emini Futures The weekly chart formed an Emini Bear Inside Bar which means the market is in breakout mode. The bears want a breakout below while the bulls want a breakout above the inside bar. The first breakout from an inside bar can fail 50% of the time. Sometimes, the candlestick […]
EURUSD Strong Bears
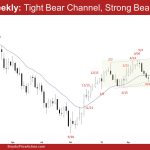
Market Overview: EURUSD Forex The weekly chart is in a tight bear channel which means EURUSD strong bears. Because of the strong move down, odds slightly favor a second leg sideways to down after a pullback. The bulls want a reversal up from a wedge bull flag. They will need to create strong bull bars […]
Crude Oil Follow-through Buying
Market Overview: Crude Oil Futures The market formed a Crude Oil follow-through buying on the monthly chart testing the 9-month trading range high. The bulls want a breakout above and a measured move-up. The bears want a failed breakout above the trading range and the beginning of the bear leg. Crude oil futures The Monthly […]
Emini Breakout Test
Market Overview: S&P 500 Emini Futures The monthly chart formed an Emini breakout test and a minor pullback. The bulls want a retest of the July 27 high followed by a breakout above. The next targets for the bulls are the March 2022 high and the all-time high. The bears want a reversal down from […]
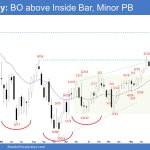
Emini Breakout Mode, Minor PB or Another Leg Down?
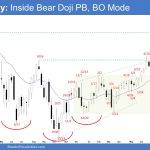
Market Overview: S&P 500 Emini Futures The weekly candlestick formed was an inside bull doji, forming an Emini breakout mode. The bulls want a breakout above, while the bears want a breakout below the inside bar. For now, odds slightly favor the current sideways to down pullback to be minor and at least a small […]
Crude Oil Weak Follow-through
Market Overview: Crude Oil Futures The weekly chart formed a Crude Oil weak follow-through bear bar. The bulls want a retest and breakout above the August 10 high. The bears want the start of the bear leg to retest the 40-week trading range low. The market is in a 40-week trading range. Traders will BLSH […]
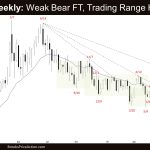
EURUSD Consecutive Closes below 20-Week EMA
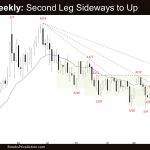
Market Overview: EURUSD Forex The weekly chart was a EURUSD consecutive closes below the 20-week EMA, testing the bull trend line. While the odds continue to favor the market to trade at least a little lower, a minor pullback can begin within a few weeks. Odds favor a second leg sideways to down after a […]
EURUSD Close below the 20-Week EMA
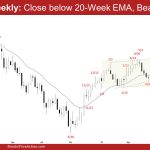
Market Overview: EURUSD Forex The EURUSD close below the 20-week EMA on the weekly chart. The bears need to create follow-through selling next week to increase the odds of lower prices. The bulls hope that the 20-week exponential moving average will act as support and want at least a small second leg sideways to up to retest […]
Crude Oil First Pullback below 7-bar Bull MC
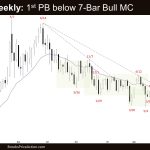
Market Overview: Crude Oil Futures The weekly chart formed a Crude Oil first pullback below the 7-bar bull microchannel. The bears need to create follow-through selling to increase the odds of the bear leg beginning. The bulls want a retest of the August 10 high followed by a breakout and a measured move up. Crude […]
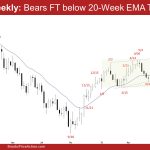
Emini Test of the 20-Week EMA
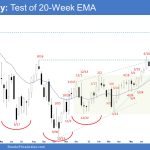
Market Overview: S&P 500 Emini Futures The bears created an Emini test of the 20-week EMA on the weekly chart. They need to create follow-through selling trading far below the 20-week EMA to increase the odds of a reversal down. The bulls see the move down as a minor pullback and want at least a […]

