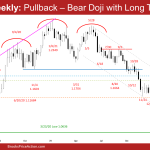
The EURUSD Forex is trading sideways after breaking below March 4 low. It may continue to trade sideways for another week or two. If there is a breakout, odds slightly favor a downside breakout more. Bulls need to create consecutive big bull bars trading far above April 21 high to convince traders that a reversal higher may be underway.
EURUSD bear follow-through on weekly chart
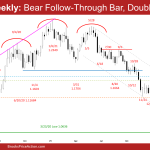
The EURUSD Forex traded sideways to down for the week. However, the weekly candlestick has a prominent tail below. The bears want a strong break below the March 4 low followed by a test of the March 2020 low. Bulls want a reversal higher from a double bottom with March 4 low and a lower low major trend reversal. The bulls will need to create strong consecutive strong bull bars to convince traders that a reversal higher could be underway. Odds slightly favor at least a small second leg sideways to down after a slightly larger pullback.
S&P 500 Emini futures consecutive bear bars
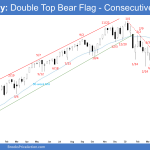
The S&P 500 Emini futures had a consecutive bear bar on the weekly chart. The bears are hoping to get the 3rd consecutive bear bar trading far below March 3 high. If they get that, the odds of a test of the February low increases. The bulls see this as a 50% pullback and want a 2nd leg sideways to up to re-test March 29 high.
EURUSD Forex reversing lower from wedge bear flag
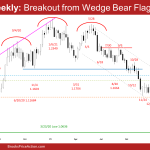
Market Overview: EURUSD Forex EURUSD Forex reversing lower from a wedge bear flag on the Daily Chart. The sell-off is in a 7-bar bear micro channel which means persistent selling. Odds favor at least a small second leg sideways to down after a pullback (bounce). EURUSD Forex market The Weekly EURUSD chart This week’s candlestick on […]
S&P 500 Emini pullback on weekly chart
Market Overview: S&P 500 Emini Futures S&P 500 Emini pullback on weekly chart. Bulls want a re-test of the March 29 high and a continuation higher to re-test the trend extreme. Bears want a reversal lower from a double top bear flag with the February high. Odds slightly favor a second leg sideways to up after the […]
Emini futures pause after testing February 2 high
Market Overview: S&P 500 Emini futures The S&P 500 Emini futures pause after testing the February 2 high this week on the weekly chart pulling back slightly to close below it. The bulls hope that this is simply a pause before the trend resumes higher to test the January high. The bears want the Emini to stall […]
Emini bull follow-through bar on weekly chart
Al added a few comments to report Market Overview: Weekend Market Analysis The SP500 Emini bulls got bull follow-through buying on the weekly chart. Odds favor a test of the February 2 high. The bulls will need to close far above the February 2 high to convince traders that a re-test of the trend extreme […]
EURUSD sideways pullback after parabolic wedge
Market Overview: Weekend Market Analysis The EURUSD Forex has been trading sideways for the last 2 to 3 weeks. The bears want a reversal lower from a double top bear flag or a wedge bear flag. If the EURUSD sideways pullback continues, odds are sellers will return to sell the pullback. The bulls want this […]
EURUSD in pullback from parabolic wedge on weekly and daily charts
EURUSD Forex: Weekend Market Analysis The EURUSD Forex is in a pullback from parabolic wedge sell-off testing the 700-pip measured move which started in October 2020. Traders are monitoring whether the bulls can create consecutive bull bars closing near their highs or the pullback is more sideways with weak bull bars. The leg down from February is […]
Emini big bull bar from wedge bull flag & HL MTR
Al added a few comments to report SP500 Emini: Weekend Market Analysis The SP500 Emini futures reversed higher with big bull bar from a wedge bull flag and a higher low major trend reversal. It broke far above the bear trend line and closed near the weekly high. Bulls hope that the correction has ended […]


