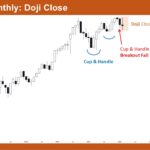
Market Overview: Nifty 50 Futures Nifty 50 Doji Close and Failed Cup and Handle Breakout on the monthly chart. The market this month formed a doji bar after a failed breakout attempt from the second cup and handle pattern, suggesting that bulls are taking profits near the all-time highs around 26,000. The failed breakout may […]
Nifty 50 Broad Bull Channel
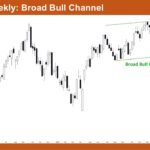
Market Overview: Nifty 50 Futures Nifty 50 Broad Bull Channel and Inside Bar on the weekly chart. The market is trading inside a broad bull channel that has been in place for almost an year. This week, the market formed an inside bar near the upper channel line, which suggests breakout mode. Since this is […]
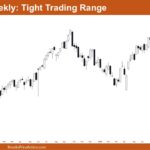
Nifty 50 Trading Range and Inside Bar
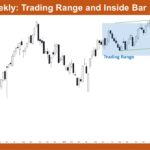
Market Overview: Nifty 50 Futures Nifty 50 Trading Range and inside bar on the weekly chart. The market this week had a strong bear close, but it is still trading inside a range. Because of this, traders can expect quick reversals, which also implies failed breakouts. On the daily chart, Nifty 50 has recently been […]
Nifty 50 Increasing Trading Range Price Action
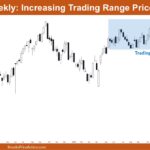
Market Overview: Nifty 50 Futures Nifty 50 Increasing Trading Range Price Action. This week, the market formed a very large bull bar but with a long tail at the top. The market is trading inside the trading range, and this week it closed near the middle of the range. Traders may wait for the market […]
Nifty 50 Double Top and a new All-Time High
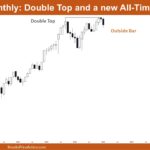
Market Overview: Nifty 50 Futures Nifty 50 Double Top and a new All-Time High. Nifty 50 formed a bearish outside bar this month, with a tail at the bottom. This is the second attempt by the bears to form a double top and trigger a reversal, after failing in their first attempt. Overall, the market […]
Nifty 50 Near Channel Bottom
Market Overview: Nifty 50 Futures Nifty 50 Near Channel Bottom. This week, the market delivered a very strong bear close near the lower trend line of the broad bull channel. On the weekly chart, the market appears to be in a trading range price action phase, so traders should manage their positions accordingly. On the […]
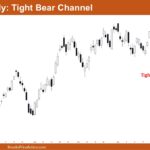
Nifty 50 Tight Trading Range
Market Overview: Nifty 50 Futures Nifty 50 Tight Trading Range on the weekly chart. This week, the market gave a weak bearish close with a small body and tails on both sides. It attempted a bearish breakout of the trading range but failed to deliver a strong close. On the daily chart, Nifty 50 had […]
Nifty 50 Bear Outside Bar
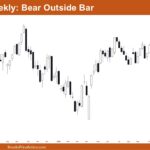
Market Overview: Nifty 50 Futures Nifty 50 Bear Outside Bar on the weekly chart. This week, the market gave a very strong bear close, closing below several previous weekly bars. In the previous week, the bulls attempted a breakout, but they failed to get good follow-through this week. On the daily chart, Nifty 50 gave […]
Nifty 50 Wedge Top
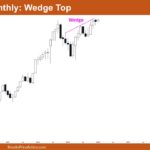
Market Overview: Nifty 50 Futures Nifty 50 Wedge Top on the monthly chart. This month, the market posted a weak bear close with a long tail at the bottom and a small body. Currently, the market is trading near the top of the wedge. On the weekly chart, Nifty 50 has shown strong follow-through this […]
Nifty 50 High-1 Breakout
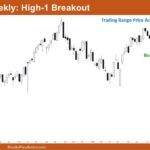
Market Overview: Nifty 50 Futures Nifty 50 High-1 Breakout on the weekly chart. This week, the market gave a weak close with a long tail at the top and a very small body. The market showed a bull breakout of the high-1 but failed to deliver a strong close, and it is still trading inside […]

