
Market Video Report: Bitcoin Duration 11:28 mins. Summary Bitcoin is facing a major bear trend or a major trading range. Within the report, we analyze the “Market Inertia” following a long-term bull trend and identify the key “Rule of Thirds” levels, targeting an equilibrium zone between $80,000 and $100,000, along with a specific trade setup […]
Gold 50% Pull Backs in Both Directions
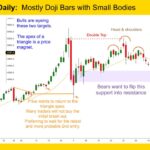
Gold GC-Mini Market Analysis The weekly Gold GC-mini chart is in a trading range following a climax. While the trend is up, the price action is becoming increasingly two-sided. This week there was bullish follow through. Printing 3 consecutive bull bars puts the market into always in long. Take note of the bull bars gradually […]
Nasdaq 100 First Close Above Ema Since Early February
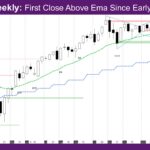
Market Overview: NASDAQ 100 E-mini Futures The NASDAQ E-mini futures week is a bull trend bar and a good entry to last week’s buy signal bar. It is the first close above EMA since early February. The EMA is the 20-period exponential moving average. The daily chart is exceptionally strong – all days were bull […]
Nifty 50 Sharp Reversal with Strong Bar
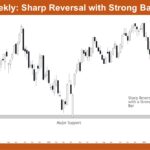
Market Overview: Nifty 50 Futures Nifty 50 Sharp Reversal with Strong Bar on the weekly chart. The market reversed sharply from major support with a very large bull bar closing near its high, which suggests strong buying pressure and that the recent selloff may have exhausted itself. This reversal bar indicates the market is likely […]
E-mini Follow-through for Bulls

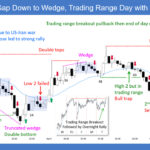
Trading Update: Friday April 10, 2026 E-mini end of day video review S&P E-mini market analysis E-mini daily chart E-mini 5-minute chart and what to expect today Yesterday’s E-mini setups Richard created the SP500 E-mini chart. Here are reasonable stop entry setups from yesterday. Chart shows each buy entry bar with a green arrow and […]
E-mini Bulls Want Test of All-Time High
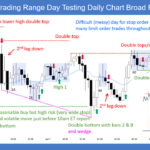
Trading Update: Thursday April 9, 2026 E-mini end of day video review S&P E-mini market analysis E-mini daily chart E-mini 5-minute chart and what to expect today Yesterday’s E-mini setups Richard created the SP500 E-mini chart. Here are reasonable stop entry setups from yesterday. Chart shows each buy entry bar with a green arrow and […]
E-mini Bulls Getting Breakout Above Daily Moving Average
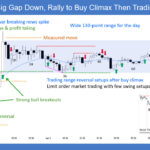
Trading Update: Wednesday April 8, 2026 E-mini end of day video review S&P E-mini market analysis E-mini daily chart E-mini 5-minute chart and what to expect today Yesterday’s E-mini setups Richard created the SP500 E-mini chart. Here are reasonable stop entry setups from yesterday. Chart shows each buy entry bar with a green arrow and […]
E-mini 6,650 Round Number Acting as Resistance
Trading Update: Tuesday April 7, 2026 S&P E-mini market analysis E-mini daily chart E-mini 5-minute chart and what to expect today Yesterday’s E-mini setups Richard created the SP500 E-mini chart. Here are reasonable stop entry setups from yesterday. Chart shows each buy entry bar with a green arrow and each sell entry bar with a […]
E-mini Sideways at Daily Moving Average
Trading Update: Monday April 6, 2026 E-mini end of day video review S&P E-mini market analysis E-mini daily chart E-mini 5-minute chart and what to expect today Last Thursday’s E-mini setups Richard created the SP500 E-mini chart. Here are reasonable stop entry setups from last Thursday, before Good Friday holiday break. Chart shows each buy […]
Nifty 50 Bull Channel
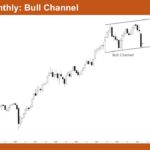
Market Overview: Nifty 50 Futures Nifty 50 Bull Channel on the monthly chart. The market has been trading in a well-defined bull channel for several years, with consistent higher highs and higher lows. Recently, the market has been consolidating near the channel top with overlapping price action, which suggests the bulls are losing momentum and […]

