Trading Update: Wednesday September 27, 2023 S&P Emini pre-open market analysis Emini daily chart Emini 5-minute chart and what to expect today Yesterday’s Emini setups Al created the SP500 Emini charts. Here are several reasonable stop entry setups from yesterday. I show each buy entry with a green rectangle and each sell entry with a […]
Emini Likely to Reach August 18 Low
Trading Update: Tuesday September 26, 2023 S&P Emini pre-open market analysis Emini daily chart Emini 5-minute chart and what to expect today Yesterday’s Emini setups Al created the SP500 Emini charts. Here are several reasonable stop entry setups from yesterday. I show each buy entry with a green rectangle and each sell entry with a […]
Emini Always In Short
Trading Update: Monday September 25, 2023 S&P Emini pre-open market analysis Emini daily chart Emini 5-minute chart and what to expect today Friday’s Emini setups Al created the SP500 Emini charts. Here are several reasonable stop entry setups from Friday. I show each buy entry with a green rectangle and each sell entry with a […]
Crude Oil Climactic Rally
Market Overview: Crude Oil Futures The weekly chart formed a Crude Oil climactic rally. While odds slightly favor the market to still be in the sideways to up phase, the move up since June has lasted a long time and is slightly climactic. A minor pullback can begin at any moment. The bears want a […]
Emini Two-legged Pullback
Market Overview: S&P 500 Emini Futures The weekly chart formed an Emini two-legged pullback testing near the February 2 breakout point. The bulls see the move simply as a pullback and want a retest of the July 27 high followed by a strong breakout above. The bears need to create follow-through selling following this week’s […]
EURUSD Tight Channel
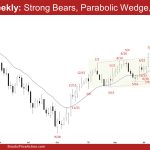
Market Overview: EURUSD Forex The weekly chart formed a EURUSD tight channel consisting of 10 consecutive bear bars. That means strong bears. Odds favor at least a small second leg sideways to down after a larger pullback. The bulls hope to get a reversal up from a parabolic wedge. EURUSD Forex market The Weekly EURUSD […]
Bitcoin Double Top Lower High below $27000
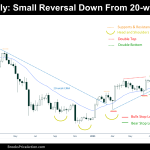
Market Overview: Bitcoin Bitcoin Double Top Lower High on the Daily Chart. This week was quiet, the price tried to trade higher but then reversed down from the 20-week Exponential Moving Average (EMA). On the Daily Chart, the price is within a Sell Zone of a Bear Channel and formed a Double Top Lower High, […]
DAX 40 Surprise DT Bear Flag, Bear Bar Below MA
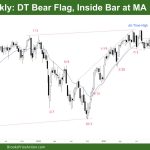
Market Overview: DAX 40 Futures DAX futures moved back down last week with a bear bar below the MA, which could be a DT bear flag but more likely BOM. When the outside down bar got FT, it set a target below, which could give us one more bear bar. But the FT has disappointed […]
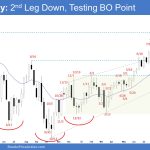
Nasdaq 100 Second Leg Down from 7/31 Is Confirmed
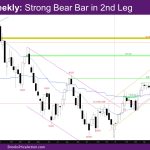
Market Overview: NASDAQ 100 Emini Futures The NASDAQ Emini futures week is a strong bear trend bar closing on its low approaching support at the weekly exponential moving average (EMA). The second leg down from 7/31 is confirmed. In other words, the first move down was from 7/31, and now the 2nd leg is confirmed. […]
Nifty 50 2nd Leg Trap
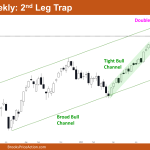
Market Overview: Nifty 50 Futures Nifty 50 2nd Leg Trap on the weekly chart. This week, the bears were able to obtain a strong bear close; however, a reversal will require a strong follow-through bar. Many bulls would be dissatisfied and postpone purchasing this bull breakout until the market once more gives a strong close […]

