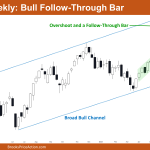
Market Overview: Nifty 50 Futures Nifty 50 Bull Follow-Through Bar on the weekly chart. After the formation of the strong outside bar, the market gave a reasonably strong close this week to carry on the upward trend. On the weekly chart, the Nifty 50 is trading inside a big bull channel. On the daily chart, […]
Nasdaq 100 Breakout Attempt above June
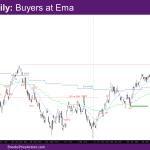
Market Overview: NASDAQ 100 Emini Futures The NASDAQ Emini futures week is a big outside up bull bar with tails at the top and bottom. The market is making a breakout attempt above June. The market continues to have closes above prior bar. This week triggered the bear reversal bar of last week and closed […]
DAX 40 Bull Inside Bar at MA Final Flag or Wedge
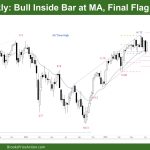
Market Overview: DAX 40 Futures DAX futures moved higher last week with a bull inside bar reversing up from the moving average. It is a triangle on a lower time frame right in the middle of a TTR. We are alternating each week but if there is any more buying it should happen above this […]
FTSE 100 Strong Bull Reversal Inside Bar Near 200-Week MA
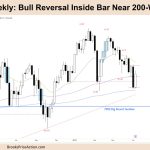
Market Overview: FTSE 100 Futures The FTSE futures market moved higher last week with a bull reversal, an inside bar on the weekly. The daily chart looks like a V reversal as the bears who had gotten trapped had a chance to exit. Bulls were looking for a chance to buy the lows of the trading […]
Emini Reversal Down Likely Minor
Trading Update: Friday July 14, 2023 S&P Emini pre-open market analysis Emini daily chart Emini 5-minute chart and what to expect today Yesterday’s Emini setups Al created the SP500 Emini charts. Here are several reasonable stop entry setups from yesterday. I show each buy entry with a green rectangle and each sell entry with a […]
Emini Breakout above June High
Trading Update: Thursday July 13, 2023 S&P Emini pre-open market analysis Emini daily chart Emini 5-minute chart and what to expect today Yesterday’s Emini setups Al created the SP500 Emini charts. Here are several reasonable stop entry setups from yesterday. I show each buy entry with a green rectangle and each sell entry with a […]
Emini test of 4,500 Round Number
Trading Update: Wednesday July 12, 2023 S&P Emini pre-open market analysis Emini daily chart Emini 5-minute chart and what to expect today Emini intraday market update Yesterday’s Emini setups Al created the SP500 Emini charts. Here are several reasonable stop entry setups from yesterday. I show each buy entry with a green rectangle and each […]
Emini Balanced forming a Triangle
Trading Update: Tuesday July 11, 2023 S&P Emini pre-open market analysis Emini daily chart Emini 5-minute chart and what to expect today Yesterday’s Emini setups Al created the SP500 Emini charts. Here are several reasonable stop entry setups from yesterday. I show each buy entry with a green rectangle and each sell entry with a […]
Emini Likely in Breakout Mode
Trading Update: Monday July 10, 2023 S&P Emini pre-open market analysis Emini daily chart Emini 5-minute chart and what to expect today Friday’s Emini setups Al created the SP500 Emini charts. Here are several reasonable stop entry setups from Friday. I show each buy entry with a green rectangle and each sell entry with a […]
Emini ioi pattern and No Follow-through Bull Bar
Market Overview: S&P 500 Emini Futures The weekly chart was an Emini ioi pattern (inside-outside-inside), which is a breakout mode pattern. The bulls did not get a follow-through bull bar following last week’s breakout above the August high. They want the market to trade above this week’s high to trigger the High 2 buy signal. However, a […]

