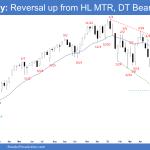
The S&P 500 Emini futures closed below the 20-month exponential moving average in June. It reversed to close above the 20-month exponential moving average in July, like the prior 2 occurrences during the sell-off in December 2018 and the Covid-19 sell-off in 2020. The bulls need to create a consecutive bull bar in August to increase the odds of a re-test of the all-time high. July is an inside bull bar. It is a breakout mode pattern. The first breakout has a 50% chance of failing.
Nasdaq 100 double bottom with May
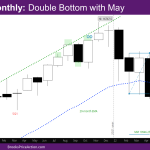
Market Overview: NASDAQ 100 Emini Futures NASDAQ Emini futures July monthly candlestick is a big bull trend 2-bar reversal reversing June’s bear bar. The month closed above last month’s high, also the most recent sell climax. A NASDAQ 100 double bottom with May. Last month’s report had made a case for July month to be a […]
EURUSD breaks below 7-year trading range
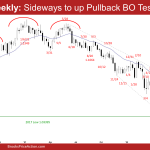
The EURUSD Forex July candlestick was a big bear bar with a long tail below. It broke below the 7-year trading range low. The long tail below indicates that the bears are not as strong as they could have been. The bears will need to create a consecutive bear bar to confirm the breakout below the 7-year trading range. The selling has been climactic. The trend channel line overshoot and wedge bottom (November 24, May 13 and July 14) increase the odds of at least a small sideways to up pullback (for a couple of weeks) before the EURUSD continue lower. The pullback may have begun in July.
Bitcoin path of least resistance
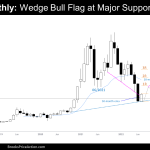
Market Overview: Bitcoin Futures The Bitcoin futures gained 28% in July because Bears took some profits right at Major Support, the path of least resistance. During the prior Monthly Bitcoin Report, we mentioned that the most important level for the rest of the year would probably be June’s Close: After July’s follow-through month, Traders think […]
FTSE 100 bull trend pullback at 20-month moving average
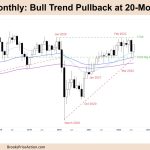
Market Overview: FTSE 100 Futures The FTSE futures market was a bull trend pullback at the 20-Month Moving Average (MA.) We are still always in long on the monthly and weekly charts but sideways, so limit order market above and below bars. Although this month looks like it is setting up a stop entry, there has […]
Dax 40 bull bar at prior breakout point
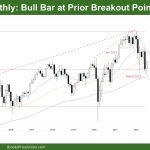
Market Overview: DAX 40 Futures DAX futures was a bull bar at a prior breakout point. It’s always in short on the monthly chart and weekly but with consecutive bull bars at prior breakout points on the weekly we might go sideways. It is a low probability buy for the bulls and it’s selling low […]
Nifty 50 futures bull flag
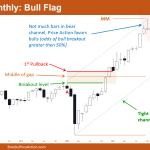
Market Overview: Nifty 50 Futures The Nifty 50 gave strong bull close in monthly chart and bulls expect this to be possible trend line of the bull channel. The move down after measured move of measuring gap was very weak to cause bear reversal. Possible Nifty 50 futures bull flag. Nifty 50 in weekly chart still […]
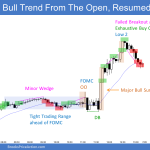
Emini bulls trying to change character of market
Trading Update: Friday July 29, 2022 Emini pre-open market analysis Emini daily chart The bulls got follow-through after the July 27 breakout. This increases the odds that the market will reach the June 2 high soon, which is the last major lower high. The bulls are trying to change the character of market and want […]
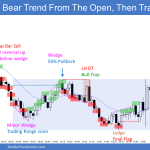
Emini bulls need follow-through test of June 2 lower high
Trading Update: Thursday July 28, 2022 Emini pre-open market analysis Emini daily chart The bulls got a bull breakout closing above the July 22 high yesterday. Bulls want this breakout to have a follow-through test today reaching the June 2nd major lower high. There is a measured move projection from the July 14 low to […]
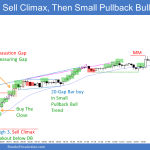
Emini likely to test July 21 close soon
Trading Update: Wednesday July 27, 2022 Emini pre-open market analysis Emini daily chart Bears ended the 8-bar bull micro channel yesterday and got a bear bar closing near its low and below the open of June 28. July 21 was a reasonable Buy The Close bar, so the market with Emini likely to test July […]

