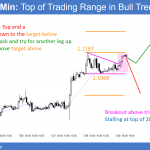
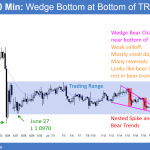
Day trading the last day of the month Updated around 6:57 a.m. The Emini opened at the 60 minute moving average, which is the middle of the 12 day tight trading range. The 1st bar was a big bull trend bar, but the follow-through was bad. This reduces the chances of an hour or two […]
Day trading the last day of the month
Day trading an August stock market bear trend
Intraday market update: July 28, 2016
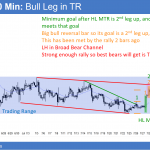
Day trading an August stock market bear trend Updated 6:55 a.m. The Emini had consecutive outside days within a tight trading range. Hence, there is resistance to breaking out above or below the prior day. An outside day, especially within a tight trading range, increases the chances of an inside day. Consecutive outside days increase […]
How to trade July FOMC Report
Intraday market update: July 27, 2016
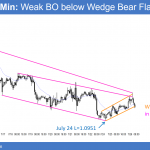
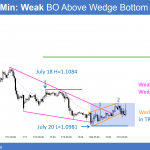
How to trade July FOMC report Updated 6:55 a.m. The Emini reversed down from above yesterday’s high and from 2 ticks below last’s week’s all-time high. However, the selloff had bull bars after bear bars. This is more typical of a weak bear trend, a trading range, or an Opening Reversal. Since the Emini is […]
Day trading the FOMC report tomorrow
Intraday market update: July 26, 2016
Getting ready to day trade tomorrow’s FOMC report: Updated 6:59 a.m. The Emini opened with a Trend From The Open Bull Trend. There is no Parabolic Wedge Top yet. The odds are that the 1st reversal down will be bought. While the rally is a buy vacuum test of yesterday’s high and a possible high […]
Democratic Convention stock market rally
Intraday market update: July 25, 2016
Democratic Convention stock market rally: Updated 6:55 a.m. Like most days over the past 2 weeks, the Emini sold off on the open. Then bulls again want an opening reversal, today, at the 60 minute moving average, and an early low of the day. The bears want a strong breakout below the 60 minute moving […]
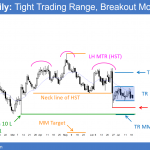
Political conventions and the stock market
Emini weekend update: July 23, 2016
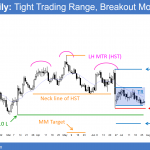
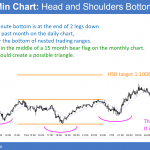
Monthly S&P500 Emini futures candlestick chart: Political conventions and the stock market The monthly S&P500 Emini futures candlestick chart has a big bull trend bar in its breakout to a new all-time high. It is the 6th consecutive bull trend bar in a strong bull trend. Some beginning traders erroneously think that there is a […]
Micro double top buy climax
Intraday market update: July 22, 2016
Micro double top buy climax: Updated 6:50 a.m. The Emini began with an opening reversal down from the 60 minute moving average, a 50% pullback, and a test near the top of yesterday’s bear channel. Furthermore, yesterday’s reversal up was minor and therefore a bear rally. Finally, yesterday had a series of Moving Average Gap […]
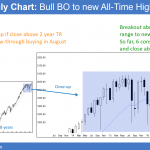
Trading new all-time high stock market breakout
Intraday market update: July 21, 2016
Trading new all-time high stock market breakout: Updated around 7:04 a.m. The Emini began with an opening reversal up from a test of the old all-time high. It was also a 2nd leg down from yesterday’s double top major trend reversal. Yet, the buy signal bar had a big tail on top. Furthermore, the Emini […]
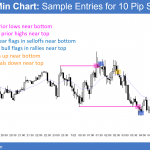
Day trading tight trading ranges
Intraday market update: July 20, 2016
Day trading tight trading ranges: Updated around 6:55 a.m. The Emini sold off early on most days over the past couple of weeks. Yet, bulls came in and created Opening Reversals. This sometimes resulted in a low of the day, and other times it simply halted the selling for an hour or so. The bulls […]
ioi breakout mode candlestick pattern
Intraday market update: July 19, 2016
ioi breakout mode candlestick pattern: I will update around 6:58 a.m. The Emini opened with 4 bars with prominent tails within yesterday’s range. This increases the chances that the 3 day tight trading range will grow. While the odds favor today trading either below yesterday’s low, above its high, or both, the probability is that […]

