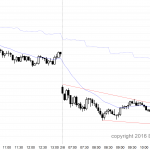
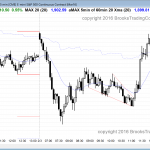
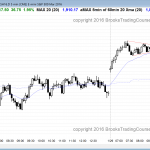
Posted 7:00 a.m. The Emini opened with a big gap down, but then then reversed up and down with big bars. This increases the chances that the Emini will enter a trading range for a couple of hours until it gets closer to the moving average. At that point, bulls will see a bottom, like […]
Intraday market update: February 8, 2016
Emini weekend update: February 6, 2016:
Trade the markets for a living when more trading range price action is likely
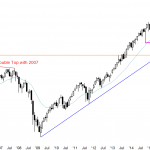
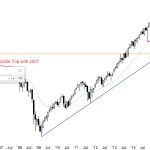
Monthly S&P500 Emini futures candlestick chart: Double top after buy climax The monthly S&P500 Emini futures candlestick chart is in breakout mode with both a double top and a double bottom after a buy climax. The monthly S&P500 Emini futures candlestick chart has a lot of price action left to the month and it is […]
Intraday market update: February 5, 2016
Learn how to trade when the price action forms a triangle
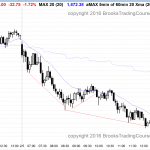
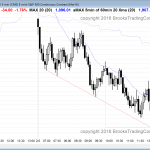
Posted 7:03 a.m. The Emini reversed up from below yesterday’s low, but the bulls have not yet done enough to make the market clearly Always In Long. The selloff and the rally so far lack consecutive strong trend bars. Yesterday was a triangle. Today’s trading range price action is a continuation of yesterday’s. Until there […]
Intraday market update: February 4, 2016
Learn how to trade confusing price action
I will post around 6:56 a.m. The day opened within yesterday’s trading range and entered breakout mode. The bulls want either a small buy signal bar near the bottom or a strong bull breakout, and the bears want either a small sell signal bar near the top or a strong bear breakout. Until then, scalpers […]
Intraday market update: February 3, 2016
Learn how to trade a 50% pullback
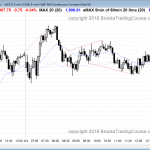
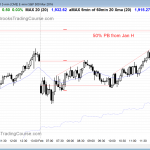
Posted 7:19 a.m. The Emini sold off strongly on the open from a gap up to the 60 minute moving average and a test of yesterday’s high to far below yesterday’s low. This selling has been extreme and therefore climactic. While it could continue all day, it more likely it will run out of sellers […]
Intraday market update: February 2, 2016
Day trading tip is that the selloff will be bought
Posted 6:45 a.m. The Emini opened with a big gap down and traded below yesterday’s low, the 60 minute moving average, and the breakout point at the top of the bear flag on the daily chart (the January 27 high). However, the odds are that there will be buyers below yesterday’s low. As bearish as […]
Intraday market update: February 1, 2016
Learn how to trade a buy climax near resistance
Posted 7:10 a.m. The Emini gapped down to the 15 minute moving average and entered a tight trading range. This is a 20 gap bar buy setup on the 15 minute chart after Friday’s strong bull trend, and that will tend to limit the downside. The big gap down will tend to limit the upside. […]
Emini weekend update: January 30, 2016:
Learn how to trade a bull breakout above a bear flag
Monthly S&P500 Emini futures candlestick chart: Triangle after buy climax The monthly S&P500 Emini futures candlestick chart is in the middle of a triangle and in breakout mode Although the daily chart is giving traders a chance to learn how to trade a bull breakout above a bear flag, the monthly S&P500 Emini futures candlestick […]
Intraday market update: January 29, 2016
Breakout mode price action
Posted 7:15 a.m. The Emini opened with a trend from the open bull trend and is Always In Long. Although the rally lacks consecutive big bull bars and tails were prominent, an 8 bar bull micro channel without any bear bodies is enough to make traders buy the 1st pullback for a scalp. With the […]
Intraday market update: January 28, 2016
Learn how to trade a sell climax in a trading range
Posted 7:01 a.m. The Emini opened with a big gap up above the 60 minute moving average and testing the top of yesterday’s bear channel. It then entered a tight trading range. This big gap up after yesterday’s big selloff creates a Big Down, Big Up, Big Confusion pattern and it increases the chances of […]

