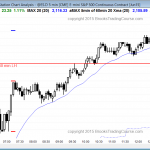
Posted 7:15 a.m. The Emini sold off on the first bar to below yesterday’s low and the 60 minute moving average, but had weak follow-through and it is at the bottom of a 2 day trading range. While this might be the start of a big bear trend day, a trading range day is more […]
Intraday market update: May 20, 2015
Intraday market update: May 19, 2015
Intraday trading strategies for a buy climax
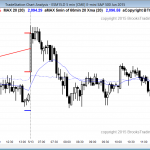
Posted 6:54 a.m. Yesterday had a spike and channel bull trend, which is usually evolves into a trading range. Today sold off to below the bottom of the channel and reversed up sharply in a big doji bar. This is trading range price action, and it may be forecasting a lot of trading range price […]
Intraday market update: May 18, 2015
How to trade futures when a breakout is weak
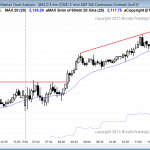
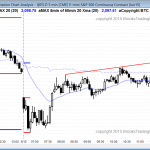
Posted 7:04 a.m. The Emini opened within Friday’s tight trading range and began with more tight trading range price action. Swing traders are waiting for a strong breakout with follow-through up or down. The Emini broke above Friday’s all-time high by 1 tick and immediately pulled back. This has been a limit order open and it […]
Emini weekend update: May 16, 2015:
How to trade futures at a new high
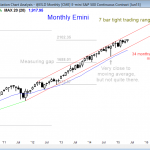
Monthly S&P500 Emini futures candlestick chart: Small breakout of 6 month tight trading range The monthly S&P500 Emini futures candlestick chart is breaking above a 6 month trading range. The monthly S&P500 Emini futures candlestick chart has been above its moving average for 34 months and there is an 80% chance that it will touch […]
Intraday market update: May 15, 2015
Learn how to trade a new high

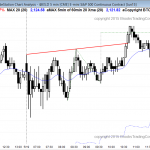
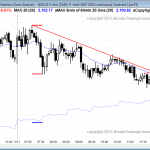
Posted 7:35 a.m. Today is a Friday and the Emini will pay attention to weekly support and resistance in the final hour. The most important prices are the all-time high of 2 weeks ago, and the open of the week, which is also the February high. Although the Emini opened at a new all-time high, […]
Intraday market update: May 14, 2015
Day trading tip is to be ready for a test of last week’s lower high
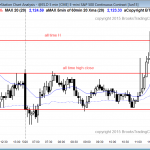
Posted 7:15 a.m. The Emini gapped above yesterday’s high, and immediately sold off, becoming Always In Short. However, it reversed up from a small double bottom and is rallying for a test last week’s lower high at 2113.50. At the moment, it is Always In Long and will probably have at least one more leg […]
Intraday market update: May 13, 2015
How to trade futures online while in breakout mode
Posted 7:11 a.m. The Emini broke about above yesterday’s high and the top of the bull channel from yesterday on the first bar, but the follow-through was disappointing for the bulls. This increases the chances of a trading range day. The bears tried to reverse the Emini, but the selloff stalled at yesterday’s high after […]
Intraday market update: May 12, 2015
Candlestick pattern is an island top
Posted 7:05 a.m. The bears had a trend from the open bear trend, but the bulls created an opening reversal up from a test of the December high, after a sell climax. The selloff alternated bull and bear bars, and the initial rally had tails on the tops of the bars. This is trading range […]
Intraday market update: May 11, 2015
Day trading strategies for a possible lower high
Posted 7:12 a.m. Friday’s tight trading range has been continuing. Traders are waiting for a breakout above last week’s lower high of 2115, or below yesterday’s low. The Emini is still Always In long, but this is meaningless when it is in a tight trading range. Swing traders have to wait for a strong breakout […]
Emini weekend update: May 9, 2015:
Learn how to trade a top
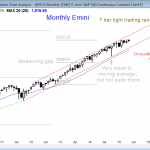
Monthly S&P500 Emini futures candlestick chart: Opportunity to learn how to trade a top The monthly S&P500 Emini futures candlestick chart has been in a tight trading range for for 7 months. The monthly S&P500 Emini futures candlestick chart is in a 7 month tight trading range and it has not touched the moving average […]

