The support forum is built with (1) General and FAQ forums for common trading queries received from aspiring and experienced traders, and (2) forums for course video topics. How to Trade Price Action and How to Trade Forex Price Action videos are consolidated into common forums.
Brooks Trading Course social media communities
Brooks Trading Course Learning Resources >>>

For those that I'm sure will continue to come here trying to figure this out as I have, the link in the 2nd post is indeed helpful.
I was thinking I would just summarize it here to make it more accessible for people, but there is some good back and forth on the thread.
I had to wait overnight for access to the other forum, but the info there is actually helpful.

Hs & Ls are simply attempts to resume the trend after a pullback. Sometimes they are very clear and sometimes they can be confusing. One way to clarify things when you are confused is to look at a smaller time frame. The pattern will often be much easier to see on a 1 minute chart. Don't try to trade the smaller time frame, just use it to see patterns that might be unclear on the 5 minute chart.

Thank you, that's helpful.

This concept has been very difficult for me to understand as well. I found Al's glossary which makes things much clearer for me:
Glossary: https://www.brookstradingcourse.com/price-action-trading-terms-glossary/
H1 & H2 from Al's glossary:
- high 1, 2, 3, or 4
A high 1 is a bar with a high above the prior bar in a bull flag or near the bottom of a trading range. If there is then a bar with a lower high (it can occur one or several bars later), the next bar in this correction whose high is above the prior bar’s high is a high 2. Third and fourth occurrences are a high 3 and 4. A high 3 is a wedge bull flag variant.
L1 & L2 Definition from Al’s glossary:
- low 1, 2, 3, or 4
A low 1 is a bar with a low below the prior bar in a bear flag or near the top of a trading range. If there is then a bar with a higher low (it can occur one or several bars later), the next bar in this correction whose low is below the prior bar’s low is a low 2. Third and fourth occurrences are a low 3 and 4. A low 3 is a wedge bear flag variant.

Could someone take a look at what I marked and let me know if I’m understanding it correctly?
The H1 was triggered on a BUY because the next candle moved above the high of the H1 candle that I marked on the chart. After a strong bull SPIKE, we have the first PULLBACK, and this is considered an H1 because the following candle went above the high of that DOJI.
H2 is a BULL candle with a long tail on the bottom. BUY above its high. When setting up the trade, we don’t know yet if it will be an H2 until the price moves above its high. The H2 candle is a Bull bar, which is an additional signal in our favor.
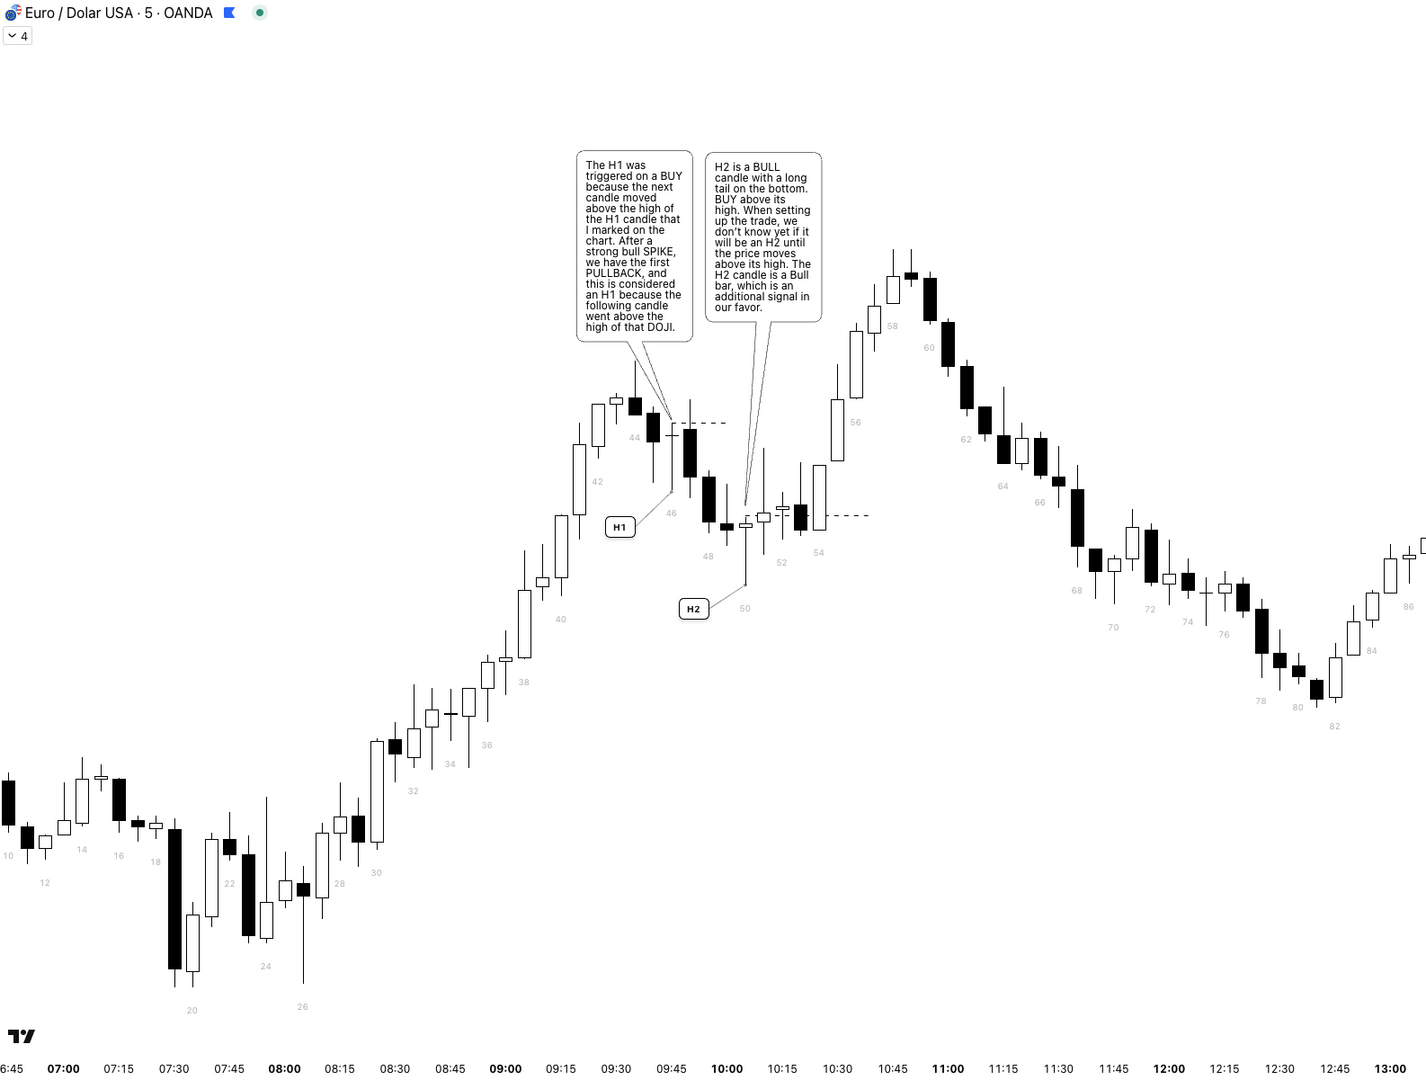

That's how I understand it too. But I wouldn't place a buy stop over a doji, that's just me.

Video 9A (Pullback & Bar Counting; Timestamp 20:27) does a good job explaining this. It was frustrating for me as well when starting out. My biggest problem is that I wanted everything absolute and clear when in reality what was more important was learning the concept. If you can understand the concept then even if the chart is label wrong youll still be able to understand where he is going.
-
H1 (High 1): The first bar that makes a new high after a pullback in a bull trend. It's often a buy setup.
-
H2 (High 2): The second attempt to go higher, often better than H2 because it has more confirmation.
-
L1 (Low 1): The first bar that makes a new low after a pullback in a bear trend. It's often a sell setup.
-
L2 (Low 2): The second attempt down, often better than L1 because it has more confirmation.
Thats how I understand it as well. The bars after H1 & H2 made a new high after the pull back in the bull trend. H2 is interesting. It didnt have good follow through at first but it did have a Micro Triangle which signaled a breakout in either direction.
"So each setup – L1, L2, H1, H2 – is a combination of two candles, interpreted within the context visible to the left of the chart. I believe that understanding this on the chart is probably the most important part of Price Action."


