The support forum is built with (1) General and FAQ forums for common trading queries received from aspiring and experienced traders, and (2) forums for course video topics. How to Trade Price Action and How to Trade Forex Price Action videos are consolidated into common forums.
Brooks Trading Course social media communities
Brooks Trading Course Learning Resources >>>

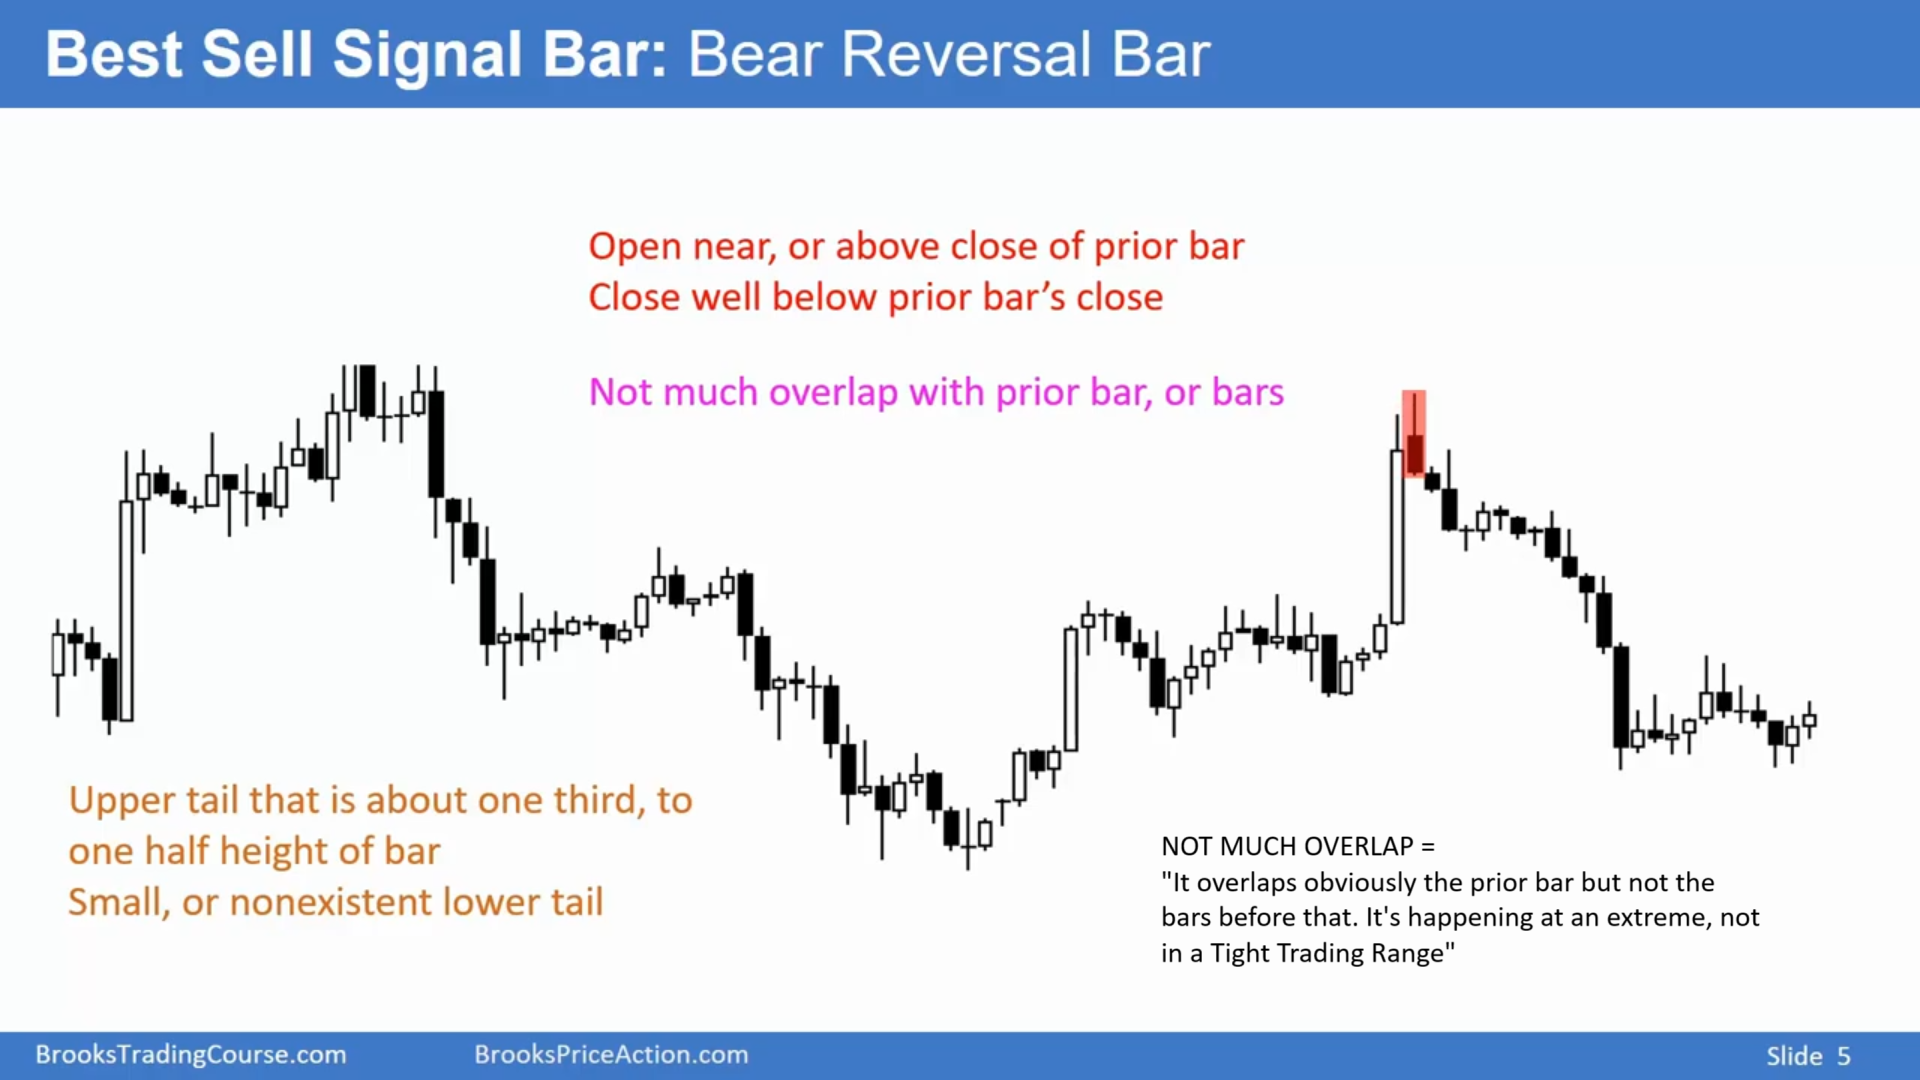
"Open near or above close of the prior bar"
Isn't it better to see a gap down open? (Eager Bears)
"Upper tail that is 1/3 to 1/2 height of bar"
Isn't it better to have no upper tail? (Bulls had no strength)

In this example the open of the signal bar is above the close of the prior bar indicating eager bulls. The big upper tail shows the buy above the bar was triggered and then selling came in disappointing those bulls and drove the market lower with that bar closing on its low. Any bulls who bought the close of the prior bar or above it were now trapped. They used the tail above the bar that came two bars later to try and get out. Any remaining bulls got out as the market went lower.

I think the idea is you want to see trapped bulls
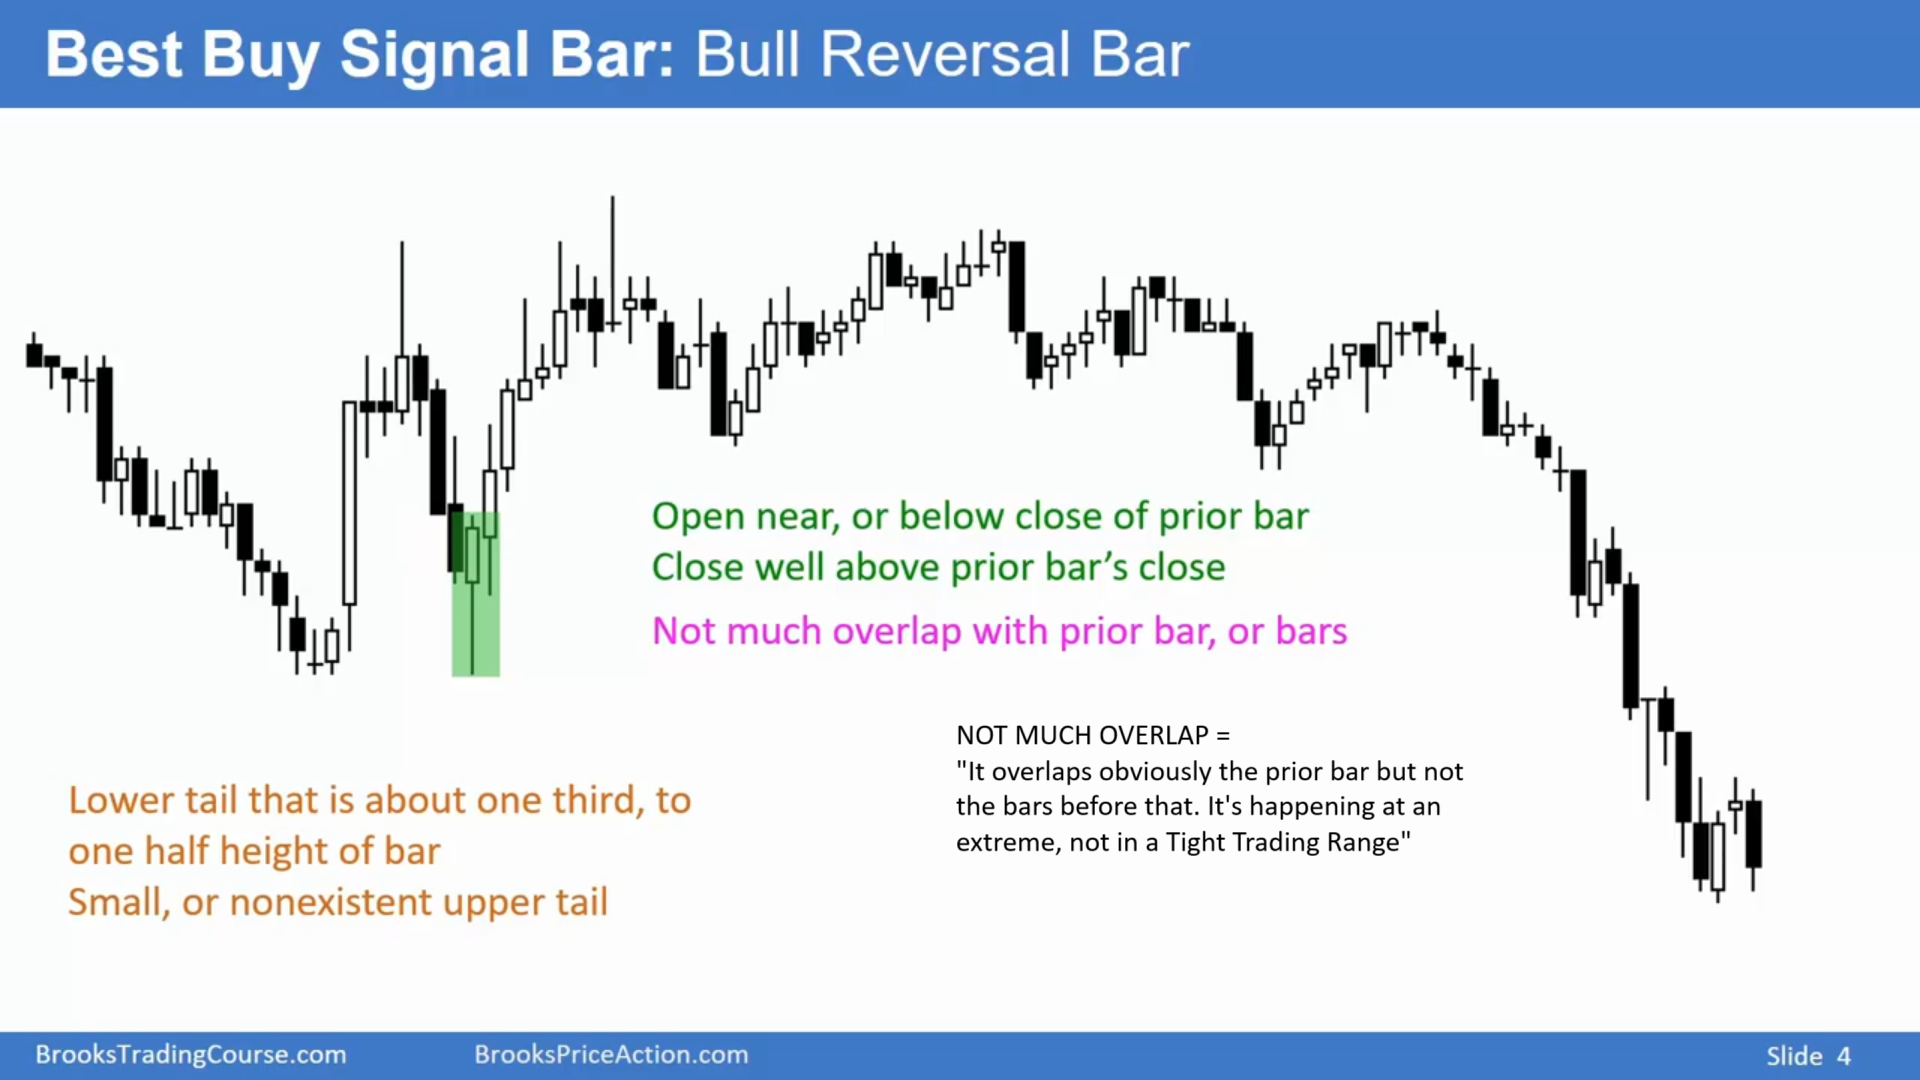
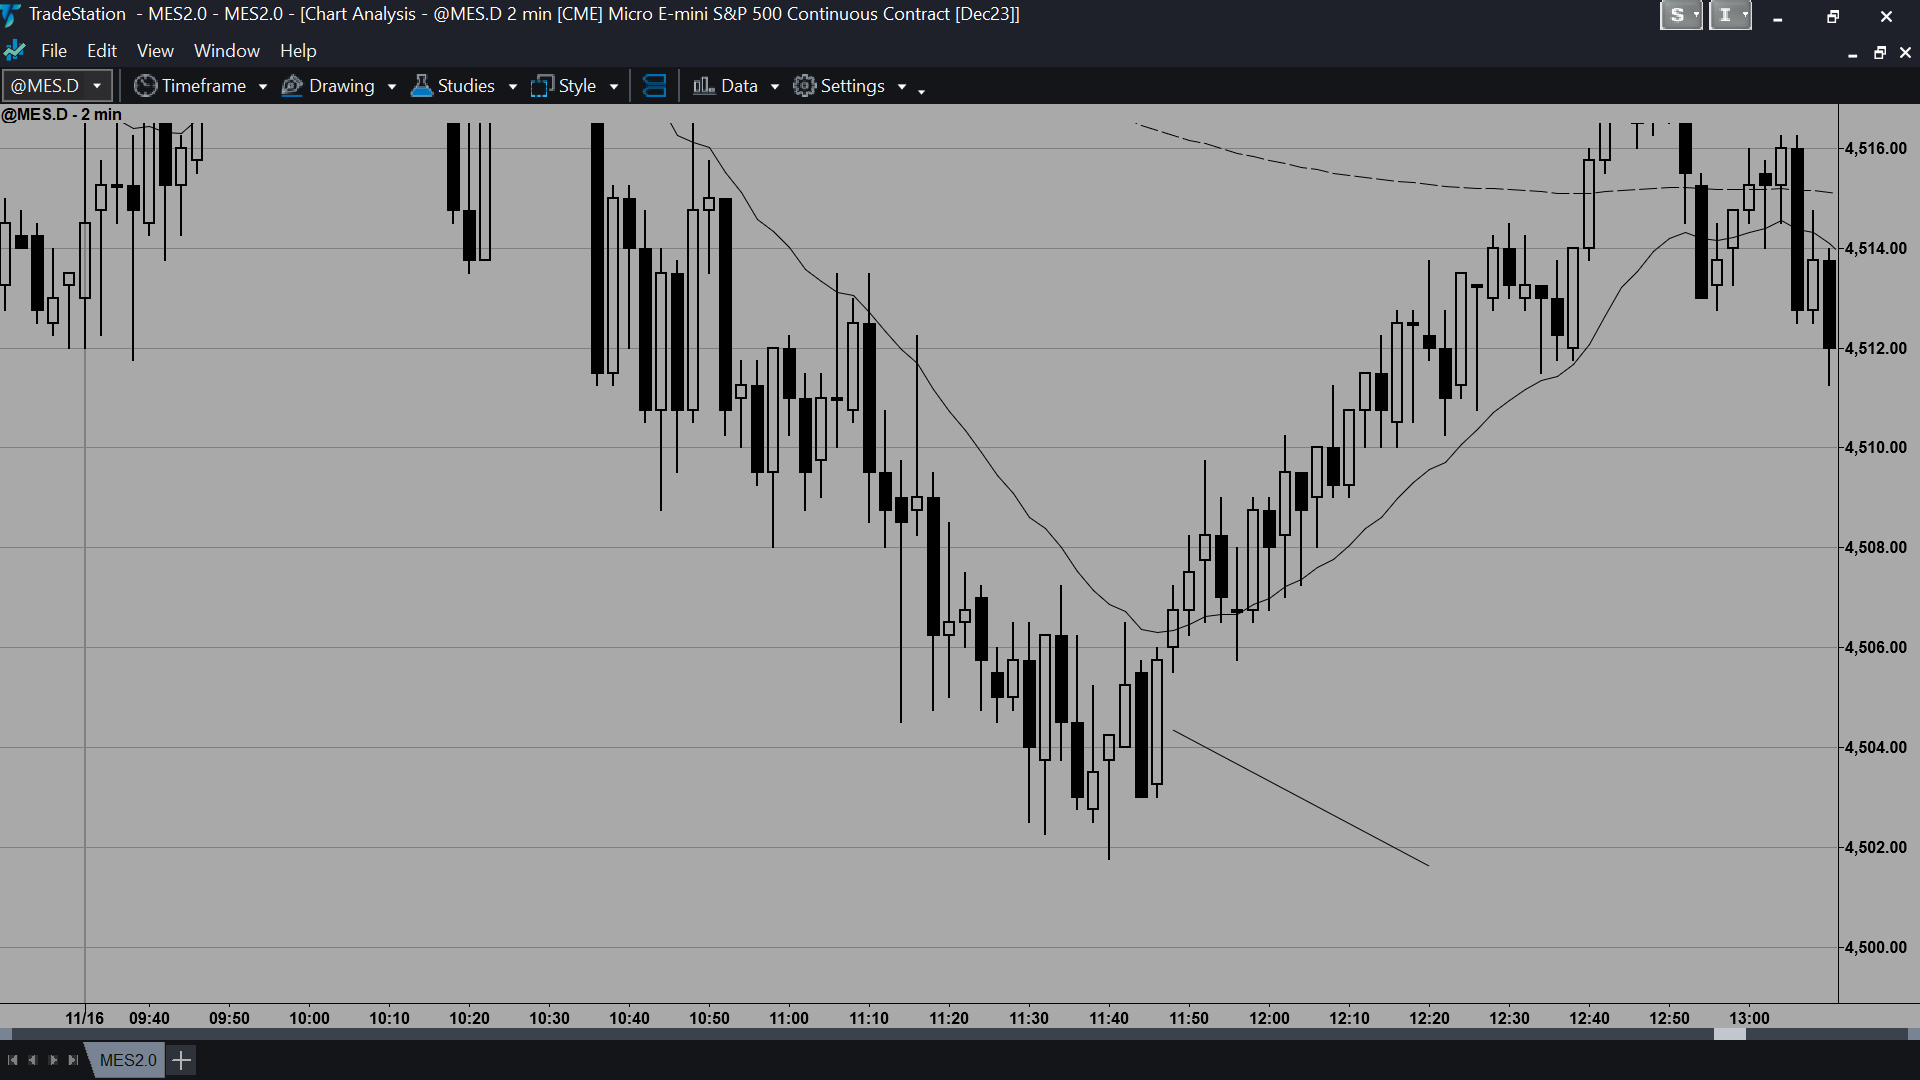
which buy signal is better?
Gap down open / Gap up open
1/3 Lower tail / No Lower tail

I may be wrong but i kind of feel like they are both very comparable. As in one isn't necessarily "better" than the other. It more so comes down to context and whats happening to the left of the chart and the day unfolding. A lot of variables. Like i feel like taking one buy signal over the other isn't necessarily going to increase your probability very much. You're probability is going to come from the rest of the information the chart has for you.

great point.
He has some slides about 'bad signals/good context' where you can buy above bear bars , etc.
Many times when trading less liquid instruments than ES, especially during overnight hours, I've seen a bar open with a 1t gap down from previous bar and more often on average it's a sign of future lower prices.
Yes, I have seen that also. I thought that was stronger than a gap open in the opposite direction.
In the slide he says "Best Bull reversal bars open near or below the close of prior bar"
Maybe that adds to the trapped traders.


