
Market Video Report: Bitcoin Duration 8:29 mins. AI is voicing Josep Capo’s original script. Summary Bitcoin remains stuck in a sideways range, with low volatility and minimal directional conviction. This consolidation phase is likely to persist until trading volume picks up again, most probably during January. The market is now poised for a decisive move: […]
Bitcoin Bear Leg in Major Trading Range near Support
Market Video Report: Bitcoin Duration 7:09 mins. AI is voicing Josep Capo’s original script. Summary The market remains always-in short within a tight bear channel on the medium-term cycle, all inside a major trading range. Current levels appeal to short-term bears but attract medium-term bulls. Transcript Hi everyone, welcome to this week’s video where we […]
Bitcoin Trading Range Day

End of Day Video Report for November 27, 2025 Duration 6 mins. AI is voicing Josep Capo’s original script. Summary Bitcoin traded in a Trading Range during a thin volume day due to US holiday session. here were definitely scalping opportunities – especially for limit-order traders willing to fade the extremes – but for pure […]
E-mini Trading Range Price Action on Daily Chart
Trading Update: Thursday November 13, 2025 E-mini end of day video review Follow Joseph’s YouTube channel for more Al Brooks price action analysis. S&P E-mini market analysis E-mini daily chart E-mini 5-minute chart and what to expect today Yesterday’s E-mini setups Richard created the SP500 E-mini chart – Al travelling. Here are reasonable stop entry […]
Bitcoin Trading Range Bars Hint Trading Range Action
End of Day Video Report for November 6, 2025 Duration 7.5 mins. AI is voicing Josep Capo’s original script. Summary For Bitcoin today, the majority of bars were trading range bars, prompting traders to buy low and sell high, as expected in such conditions.
Bitcoin in Sideways Trading Range

Market Video Report: Bitcoin Futures Duration 10 mins. AI is voicing Josep Capo’s original script. Summary Analysis of Bitcoin’s weekly and daily charts. The weekly chart shows sideways trading, balancing the market after a bull cup-and-handle breakout. On the daily chart, price is in the middle of a trading range decreasing its velocity, suggesting a […]
E-Mini Bull Channel Evolving into Trading Range
Trading Update: Monday September 8, 2025 S&P E-mini market analysis E-mini daily chart E-mini 5-minute chart and what to expect today Friday’s E-mini setups Al created the SP500 E-mini charts. Here are reasonable stop entry setups from Friday. I show each buy entry bar with a green arrow and each sell entry bar with a […]
E-Mini Daily Chart Likely to Evolve Into Trading Range
Trading Update: Friday August 29, 2025 E-mini end of day video review Follow Joseph’s YouTube channel for more Al Brooks price action analysis. S&P E-mini market analysis E-mini daily chart E-mini 5-minute chart and what to expect today Yesterday’s E-mini setups Al created the SP500 E-mini chart. Here are reasonable stop entry setups from yesterday. […]
Emini Bear Trap Then Small Pullback Bull Trend
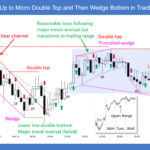
Trading Update: Thursday December 26, 2024 Emini end of day video review Follow Joseph’s YouTube channel for more Al Brooks price action analysis. Monday’s (pre-Christmas) Emini setups Here are reasonable stop entry setups from Monday (before Christmas break). I show each buy entry bar with a green arrow and each sell entry bar with a […]
Emini Bull Profit Taking Likely
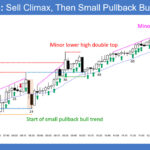
Trading Update: Monday September 16, 2024 End of day video review S&P Emini market analysis Emini daily chart Emini 5-minute chart and what to expect today Friday’s Emini setups Al created the SP500 Emini charts. Here are reasonable stop entry setups from Friday. I show each buy entry bar with a green arrow and each […]

