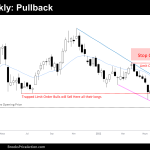
Market Overview: Bitcoin Futures Bitcoin pullback finally became a reality after the price stalled at major support. Traders expect the price to reach $28800 during the upcoming months. Bitcoin futures The Weekly chart of Bitcoin futures Traders still think that the Bear Trend on the Weekly chart is contained within a Trading Range; therefore, the […]
EURUSD weak bear follow-through retesting low
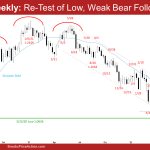
The EURUSD Forex re-tested the low and the bears got a weak follow-through bar on the weekly chart. The bears want a breakout below the May low followed by a measured move down based on the height of the 7-year trading range. The bulls want a reversal higher from a double bottom major trend reversal following the trend channel line overshoot and wedge bottom.
Suporte e Resistência

This page is restricted for Trading Course members only. Please log in to view content. Nome de usuário ou email Senha Lembrar-me Esqueci a senha
Emini testing March 2021 gap
Trading Update: Wednesday May 11, 2022 Emini pre-open market analysis Emini daily chart Emini testing March 2021 gap on the daily chart yesterday. The bears want to close below the gap as well as the March 17, 2021, breakout point, which would demonstrate the strength of the bears. The bears closed below the three-month […]
Emini market testing May 2 low
Trading Update: Monday May 9, 2022 Emini pre-open market analysis Emini daily chart Friday closed as a doji bar with a small bull body around the May 2 low. Emini market testing May 2 low and bulls hope the market is forming a double bottom, which will lead to a test of the May 4 […]
Emini monthly big bear bar testing 20-month EMA
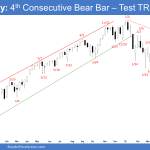
The S&P 500 Emini futures has 4 consecutive bear bars closing near the low on the weekly chart, testing the February low. The bears need a couple of closes below the February low on the weekly chart to convince traders that a deeper correction may be underway. The bulls hope that this is simply a sell vacuum test of the trading range low.
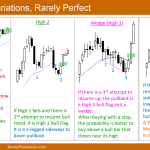
The Monthly candlestick is forming the second leg down from the January top. The Emini is in a 9-month trading range. While odds slightly favor a test below February low, breakouts from trading ranges fail 50% of the time.
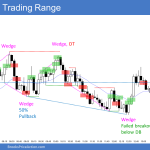
Emini bear follow through testing support zone
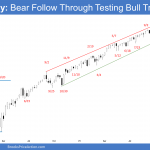
Al added some comments to report Market Overview: Weekend Market Analysis The SP500 Emini futures traded below November’s low on the monthly chart following a failed OO (Outside-Outside) pattern. Since the bull trend is strong, this is a minor sell signal with an Emini bear follow through bar. There are several support zones around the […]